Chrysler 2011 Annual Report Download - page 170
Download and view the complete annual report
Please find page 170 of the 2011 Chrysler annual report below. You can navigate through the pages in the report by either clicking on the pages listed below, or by using the keyword search tool below to find specific information within the annual report.-
 1
1 -
2
-
3
-
4
-
5
-
6
-
7
-
8
-
9
-
10
-
11
-
12
-
13
-
14
-
15
-
16
-
17
-
18
-
19
-
20
-
21
-
22
-
23
-
24
-
25
-
26
-
27
-
28
-
29
-
30
-
31
-
32
-
33
-
34
-
35
-
36
-
37
-
38
-
39
-
40
-
41
-
42
-
43
-
44
-
45
-
46
-
47
-
48
-
49
-
50
-
51
-
52
-
53
-
54
-
55
-
56
-
57
-
58
-
59
-
60
-
61
-
62
-
63
-
64
-
65
-
66
-
67
-
68
-
69
-
70
-
71
-
72
-
73
-
74
-
75
-
76
-
77
-
78
-
79
-
80
-
81
-
82
-
83
-
84
-
85
-
86
-
87
-
88
-
89
-
90
-
91
-
92
-
93
-
94
-
95
-
96
-
97
-
98
-
99
-
100
-
101
-
102
-
103
-
104
-
105
-
106
-
107
-
108
-
109
-
110
-
111
-
112
-
113
-
114
-
115
-
116
-
117
-
118
-
119
-
120
-
121
-
122
-
123
-
124
-
125
-
126
-
127
-
128
-
129
-
130
-
131
-
132
-
133
-
134
-
135
-
136
-
137
-
138
-
139
-
140
-
141
-
142
-
143
-
144
-
145
-
146
-
147
-
148
-
149
-
150
-
151
-
152
-
153
-
154
-
155
-
156
-
157
-
158
-
159
-
 160
160 -
 161
161 -
 162
162 -
 163
163 -
 164
164 -
 165
165 -
 166
166 -
 167
167 -
 168
168 -
 169
169 -
 170
170 -
 171
171 -
 172
172 -
 173
173 -
 174
174 -
 175
175 -
 176
176 -
 177
177 -
 178
178 -
 179
179 -
 180
180 -
181
-
182
-
183
-
184
-
185
-
186
-
187
-
188
-
189
-
190
-
191
-
192
-
193
-
194
-
195
-
196
-
197
-
198
-
199
-
200
-
201
-
202
-
203
-
204
-
205
-
206
-
207
-
208
-
209
-
210
-
211
-
212
-
213
-
214
-
215
-
216
-
217
-
218
-
219
-
220
-
221
-
222
-
223
-
224
-
225
-
226
-
227
-
228
-
229
-
230
-
231
-
232
-
233
-
234
-
235
-
236
-
237
-
238
-
239
-
240
-
241
-
242
-
243
-
244
-
245
-
246
-
247
-
248
-
249
-
250
-
251
-
252
-
253
-
254
-
255
-
256
-
257
-
258
-
259
-
260
-
261
-
262
-
263
-
264
-
265
-
266
-
267
-
268
-
269
-
270
-
271
-
272
-
273
-
274
-
275
-
276
-
277
-
278
-
279
-
280
-
281
-
282
-
283
-
284
-
285
-
286
-
287
-
288
-
289
-
290
-
291
-
292
-
293
-
294
-
295
-
296
-
297
-
298
-
299
-
300
-
301
-
302
-
303
-
304
-
305
-
306
-
307
-
308
-
309
-
310
-
311
-
312
-
313
-
314
-
315
-
316
-
317
-
318
-
319
-
320
-
321
-
322
-
323
-
324
-
325
-
326
-
327
-
328
-
329
-
330
-
331
-
332
-
333
-
334
-
335
-
336
-
337
-
338
-
339
-
340
-
341
-
342
-
343
-
344
-
345
-
346
-
347
-
348
-
349
-
350
-
351
-
352
-
353
-
354
-
355
-
356
-
357
-
358
-
359
-
360
-
361
-
362
-
363
-
364
-
365
-
366
-
367
-
368
-
369
-
370
-
371
-
372
-
373
-
374
-
375
-
376
-
377
-
378
-
379
-
380
-
381
-
382
-
383
-
384
-
385
-
386
-
387
-
388
-
389
-
390
-
391
-
392
-
393
-
394
-
395
-
396
-
397
-
398
-
399
-
400
-
401
-
402
 |
 |
169
Consolidated
Financial Statements
at 31 December 2011
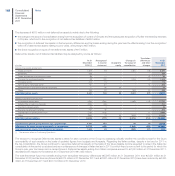
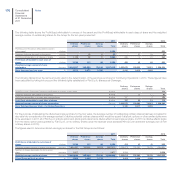
In particular, at 31 December 2011 Deferred tax assets, net of Deferred tax liabilities, include tax benefits arising from unused tax losses of €783 million
(€1,012 million for Continuing Operations at 31 December 2010). At 31 December 2011, further tax benefits arising from unused tax losses amounting to
€2,432 million have not been recognised. At 31 December 2010 the corresponding item for Continuing Operations was €1.569 million.
Deferred taxes have not been provided on the undistributed earnings of subsidiaries since the Fiat Group Post-Demerger and the Fiat Industrial Group is
able to control the timing of the distribution of these reserves and it is probable that they will not be distributed in the foreseeable future.
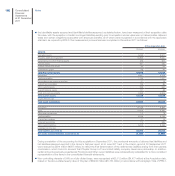
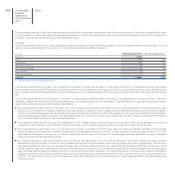
The totals of deductible and taxable temporary differences and accumulated tax losses at 31 December 2011, together with the amounts for which deferred
tax assets have not been recognised, analysed by year of expiry, are as follows:
Year of expiry
(€ million)
At 31
December
2011 2012 2013 2014 2015
Beyond
2015
Unlimited/
indeterminable
Temporary differences and tax losses relating to State taxation
(IRES in the case of Italy):
Deductible temporary differences 17,843 4,373 1,983 1,975 2,011 7,363 138
Taxable temporary differences (13,170) (1,803) (1,419) (1,327) (1,242) (5,796) (1,583)
Tax losses 11,150 107 134 153 907 2,134 7,715
Temporary differences and tax losses for which
deferred tax assets have not been recognised (14,261) (1,639) (749) (658) (1,423) (3,511) (6,281)
Temporary differences and tax losses relating
to State taxation 1,562 1,038 (51) 143 253 190 (11)
Temporary differences and tax losses relating to local taxation
(IRAP in the case of Italy):
Deductible temporary differences 17,870 3,521 2,363 2,323 2,278 7,340 45
Taxable temporary differences (13,417) (2,341) (2,150) (2,044) (1,950) (4,852) (80)
Tax losses 2,080 11 26 16 612 760 655
Temporary differences and tax losses for which deferred tax
assets have not been recognised (6,102) (478) (407) (378) (955) (3,237) (647)
Temporary differences and tax losses relating to local taxation 431 713 (168) (83) (15) 11 (27)
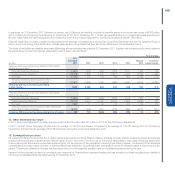
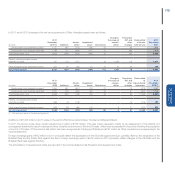
12. Other information by nature
In 2011 the income statement includes personnel costs of €6,320 million (€4,767 million in 2010 for the Continuing Operations).
In 2011 the Fiat Group excluding Chrysler had an average of 140,216 employees, compared to an average of 135,081 during 2010 for Continuing
Operations. Chrysler had an average of 55,188 employees during the period June-December 2011.
13. Earnings/(loss) per share
As explained in Note 24 below, Fiat S.p.A. share capital is represented by three different classes of shares (ordinary shares, preference shares and savings
shares) which participate in dividends with different rights. In 2011 and in 2010 Profit or loss for the period attributable to each class of share is determined
in accordance with the share’s contractual dividend rights. For the purpose of the calculation of earnings per share, however, the amount of the dividends
contractually due to each class of share on the theoretical total distribution of profit has been subtracted from the Profits attributable to the owners of the
parent. The amount obtained in this way has then been divided by the weighted average number of outstanding shares during the year.
Payment of the proposed dividend is contingent upon approval by Shareholders in general meeting and has therefore not been recognised as a liability in
the Group Consolidated financial statements at 31 December 2011.