Chrysler 2011 Annual Report Download - page 79
Download and view the complete annual report
Please find page 79 of the 2011 Chrysler annual report below. You can navigate through the pages in the report by either clicking on the pages listed below, or by using the keyword search tool below to find specific information within the annual report.-
 1
1 -
2
-
3
-
4
-
5
-
6
-
7
-
8
-
9
-
10
-
11
-
12
-
13
-
14
-
15
-
16
-
17
-
18
-
19
-
20
-
21
-
22
-
23
-
24
-
25
-
26
-
27
-
28
-
29
-
30
-
31
-
32
-
33
-
34
-
35
-
36
-
37
-
38
-
39
-
40
-
41
-
42
-
43
-
44
-
45
-
46
-
47
-
48
-
49
-
50
-
51
-
52
-
53
-
54
-
55
-
56
-
57
-
58
-
59
-
60
-
61
-
62
-
63
-
64
-
65
-
66
-
67
-
68
-
 69
69 -
 70
70 -
 71
71 -
 72
72 -
 73
73 -
 74
74 -
 75
75 -
 76
76 -
 77
77 -
 78
78 -
 79
79 -
 80
80 -
 81
81 -
 82
82 -
 83
83 -
 84
84 -
 85
85 -
 86
86 -
 87
87 -
 88
88 -
 89
89 -
90
-
91
-
92
-
93
-
94
-
95
-
96
-
97
-
98
-
99
-
100
-
101
-
102
-
103
-
104
-
105
-
106
-
107
-
108
-
109
-
110
-
111
-
112
-
113
-
114
-
115
-
116
-
117
-
118
-
119
-
120
-
121
-
122
-
123
-
124
-
125
-
126
-
127
-
128
-
129
-
130
-
131
-
132
-
133
-
134
-
135
-
136
-
137
-
138
-
139
-
140
-
141
-
142
-
143
-
144
-
145
-
146
-
147
-
148
-
149
-
150
-
151
-
152
-
153
-
154
-
155
-
156
-
157
-
158
-
159
-
160
-
161
-
162
-
163
-
164
-
165
-
166
-
167
-
168
-
169
-
170
-
171
-
172
-
173
-
174
-
175
-
176
-
177
-
178
-
179
-
180
-
181
-
182
-
183
-
184
-
185
-
186
-
187
-
188
-
189
-
190
-
191
-
192
-
193
-
194
-
195
-
196
-
197
-
198
-
199
-
200
-
201
-
202
-
203
-
204
-
205
-
206
-
207
-
208
-
209
-
210
-
211
-
212
-
213
-
214
-
215
-
216
-
217
-
218
-
219
-
220
-
221
-
222
-
223
-
224
-
225
-
226
-
227
-
228
-
229
-
230
-
231
-
232
-
233
-
234
-
235
-
236
-
237
-
238
-
239
-
240
-
241
-
242
-
243
-
244
-
245
-
246
-
247
-
248
-
249
-
250
-
251
-
252
-
253
-
254
-
255
-
256
-
257
-
258
-
259
-
260
-
261
-
262
-
263
-
264
-
265
-
266
-
267
-
268
-
269
-
270
-
271
-
272
-
273
-
274
-
275
-
276
-
277
-
278
-
279
-
280
-
281
-
282
-
283
-
284
-
285
-
286
-
287
-
288
-
289
-
290
-
291
-
292
-
293
-
294
-
295
-
296
-
297
-
298
-
299
-
300
-
301
-
302
-
303
-
304
-
305
-
306
-
307
-
308
-
309
-
310
-
311
-
312
-
313
-
314
-
315
-
316
-
317
-
318
-
319
-
320
-
321
-
322
-
323
-
324
-
325
-
326
-
327
-
328
-
329
-
330
-
331
-
332
-
333
-
334
-
335
-
336
-
337
-
338
-
339
-
340
-
341
-
342
-
343
-
344
-
345
-
346
-
347
-
348
-
349
-
350
-
351
-
352
-
353
-
354
-
355
-
356
-
357
-
358
-
359
-
360
-
361
-
362
-
363
-
364
-
365
-
366
-
367
-
368
-
369
-
370
-
371
-
372
-
373
-
374
-
375
-
376
-
377
-
378
-
379
-
380
-
381
-
382
-
383
-
384
-
385
-
386
-
387
-
388
-
389
-
390
-
391
-
392
-
393
-
394
-
395
-
396
-
397
-
398
-
399
-
400
-
401
-
402
 |
 |

Report on
Operations
78
Financial
Review –
Fiat Group
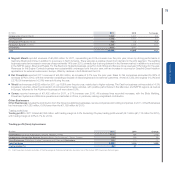
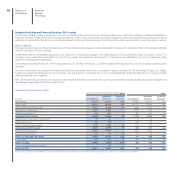
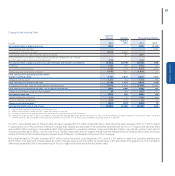
Following is a summary of the principal components of operating profit, by sector:
Trading profit/(loss)
Gains/(losses) on
disposal of investments Restructuring costs
Other unusual income/
(expense) Operating profit/(loss)
(€ million) 2011 2010 2011 2010 2011 2010 2011 2010 2011 2010
Fiat Group Automobiles 430 607 1-78 90 1,523 (2) 1,876 515
Chrysler 1,345 ---(7) -(152) -1,200 -
Maserati 40 24 ------40 24
Ferrari 312 303 6----(1) 318 302
Components (Magneti Marelli) 181 98 -116 26 (138) -27 73
Fiat Powertrain 131 140 310 -(3) -19 134 172
Metallurgical Products (Teksid) 26 17 ----(28) -(2) 17
Production Systems (Comau) 10 (6) ----(130) -(120) (6)
Other Businesses and Eliminations (83) (71) 11 115 5(50) (30) (137) (105)
Total Fiat Group 2,392 1,112 21 12 102 118 1,025 (14) 3,336 992
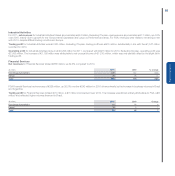
Profit/(loss)
Net financial expense for 2011 totaled €1,282 million. Excluding Chrysler, net financial expense was €796 million (€400 million in 2010). Net of the result
from the marking-to-market of the two Fiat stock option-related equity swaps (€108 million loss for 2011, compared to €111 million gain for 2010), net
financial expense for Fiat excluding Chrysler increased by €177 million over the prior year (from €511 to €688 million), reflecting higher cost of carry in
2011 and a non-recurring gain in 2010.
Income from investments totaled €131 million (of which €1 million relating to Chrysler), up from €114 million for 2010. The figure primarily relates to the
Group’s share of the profit or loss of investees recognized using the equity method (€146 million in 2011 vs. €120 million in 2010), broken down by sector
as follows: Fiat Group Automobiles €146 million (€131 million in 2010), Magneti Marelli -€18 million (-€5 million in 2010), other sectors €3 million (-€12
million in 2010).
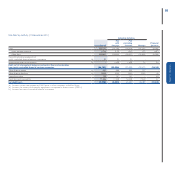
Profit before taxes was €2,185 million. Excluding Chrysler, profit before taxes was €1,470 million (€706 million for 2010). The €764 million increase mainly
reflected a €1,209 million positive difference in net unusual items, which was partially offset by higher net financial expense.
Income taxes for 2011 totaled €534 million. Excluding Chrysler, income taxes were €464 million (€484 million for 2010) and related primarily to taxable
income of companies operating outside Italy and employment-related taxes in Italy.
Net profit for 2011 was €1,651 million (€222 million for 2010). Excluding Chrysler, unusuals and the mark-to-market of the two Fiat stock option-related
equity swaps, the net result was break-even, compared with a profit of €231 million for 2010.
Profit attributable to owners of the parent was €1,334 million (€378 million for 2010).