Chrysler 2011 Annual Report Download - page 89
Download and view the complete annual report
Please find page 89 of the 2011 Chrysler annual report below. You can navigate through the pages in the report by either clicking on the pages listed below, or by using the keyword search tool below to find specific information within the annual report.-
 1
1 -
2
-
3
-
4
-
5
-
6
-
7
-
8
-
9
-
10
-
11
-
12
-
13
-
14
-
15
-
16
-
17
-
18
-
19
-
20
-
21
-
22
-
23
-
24
-
25
-
26
-
27
-
28
-
29
-
30
-
31
-
32
-
33
-
34
-
35
-
36
-
37
-
38
-
39
-
40
-
41
-
42
-
43
-
44
-
45
-
46
-
47
-
48
-
49
-
50
-
51
-
52
-
53
-
54
-
55
-
56
-
57
-
58
-
59
-
60
-
61
-
62
-
63
-
64
-
65
-
66
-
67
-
68
-
69
-
70
-
71
-
72
-
73
-
74
-
75
-
76
-
77
-
78
-
 79
79 -
 80
80 -
 81
81 -
 82
82 -
 83
83 -
 84
84 -
 85
85 -
 86
86 -
 87
87 -
 88
88 -
 89
89 -
 90
90 -
 91
91 -
 92
92 -
 93
93 -
 94
94 -
 95
95 -
 96
96 -
 97
97 -
 98
98 -
 99
99 -
100
-
101
-
102
-
103
-
104
-
105
-
106
-
107
-
108
-
109
-
110
-
111
-
112
-
113
-
114
-
115
-
116
-
117
-
118
-
119
-
120
-
121
-
122
-
123
-
124
-
125
-
126
-
127
-
128
-
129
-
130
-
131
-
132
-
133
-
134
-
135
-
136
-
137
-
138
-
139
-
140
-
141
-
142
-
143
-
144
-
145
-
146
-
147
-
148
-
149
-
150
-
151
-
152
-
153
-
154
-
155
-
156
-
157
-
158
-
159
-
160
-
161
-
162
-
163
-
164
-
165
-
166
-
167
-
168
-
169
-
170
-
171
-
172
-
173
-
174
-
175
-
176
-
177
-
178
-
179
-
180
-
181
-
182
-
183
-
184
-
185
-
186
-
187
-
188
-
189
-
190
-
191
-
192
-
193
-
194
-
195
-
196
-
197
-
198
-
199
-
200
-
201
-
202
-
203
-
204
-
205
-
206
-
207
-
208
-
209
-
210
-
211
-
212
-
213
-
214
-
215
-
216
-
217
-
218
-
219
-
220
-
221
-
222
-
223
-
224
-
225
-
226
-
227
-
228
-
229
-
230
-
231
-
232
-
233
-
234
-
235
-
236
-
237
-
238
-
239
-
240
-
241
-
242
-
243
-
244
-
245
-
246
-
247
-
248
-
249
-
250
-
251
-
252
-
253
-
254
-
255
-
256
-
257
-
258
-
259
-
260
-
261
-
262
-
263
-
264
-
265
-
266
-
267
-
268
-
269
-
270
-
271
-
272
-
273
-
274
-
275
-
276
-
277
-
278
-
279
-
280
-
281
-
282
-
283
-
284
-
285
-
286
-
287
-
288
-
289
-
290
-
291
-
292
-
293
-
294
-
295
-
296
-
297
-
298
-
299
-
300
-
301
-
302
-
303
-
304
-
305
-
306
-
307
-
308
-
309
-
310
-
311
-
312
-
313
-
314
-
315
-
316
-
317
-
318
-
319
-
320
-
321
-
322
-
323
-
324
-
325
-
326
-
327
-
328
-
329
-
330
-
331
-
332
-
333
-
334
-
335
-
336
-
337
-
338
-
339
-
340
-
341
-
342
-
343
-
344
-
345
-
346
-
347
-
348
-
349
-
350
-
351
-
352
-
353
-
354
-
355
-
356
-
357
-
358
-
359
-
360
-
361
-
362
-
363
-
364
-
365
-
366
-
367
-
368
-
369
-
370
-
371
-
372
-
373
-
374
-
375
-
376
-
377
-
378
-
379
-
380
-
381
-
382
-
383
-
384
-
385
-
386
-
387
-
388
-
389
-
390
-
391
-
392
-
393
-
394
-
395
-
396
-
397
-
398
-
399
-
400
-
401
-
402
 |
 |
Report on
Operations
88
Financial
Review –
Fiat Group
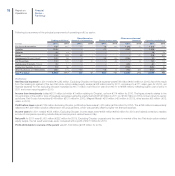
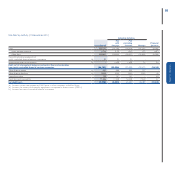
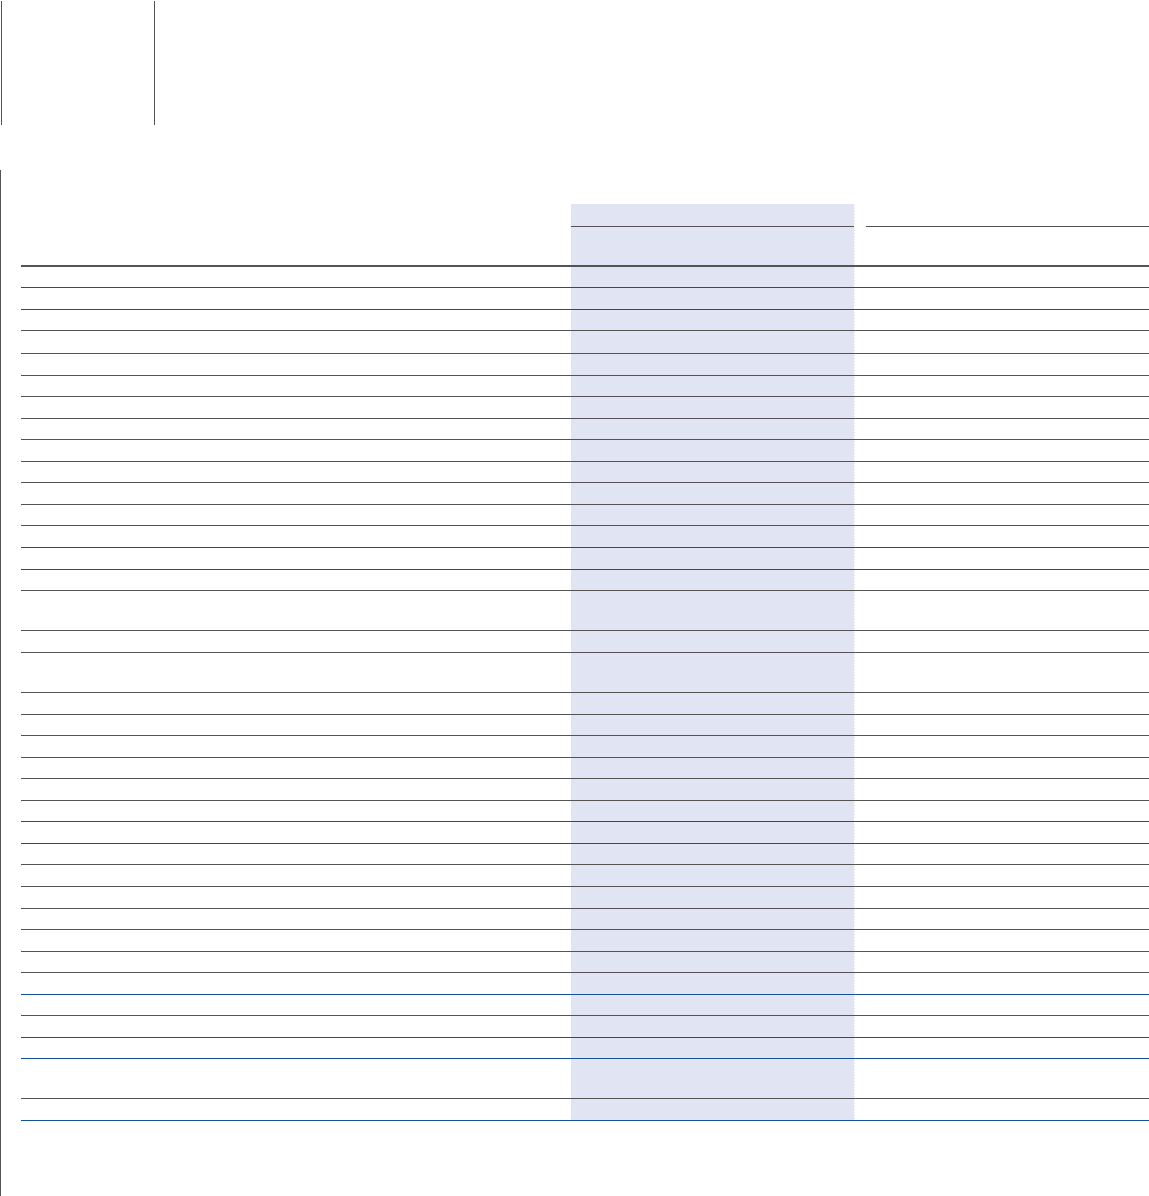
Statement of Cash Flows by Activity
2011 2010 (*)
(€ million) Consolidated
Industrial
Activities
Financial
Services Consolidated
Industrial
Activities
Financial
Services
A) Cash and cash equivalents at beginning of year 11,967 11,705 262 12,226 10,819 1,407
B) Cash from/(used in) operating activities:
Profit/(loss) 1,651 1,651 131 222 222 114
Amortization and depreciation (net of vehicles leased out) 3,358 3,356 2 2,186 2,184 2
(Gains)/losses on disposal of non-current assets and other non-cash items (a) (1,106) (1,200) (37) 74 2 (42)
Dividends received 105 149 - 62 107 -
Change in provisions (116) (89) (27) 283 284 (1)
Change in deferred taxes (19) (10) (9) (199) (197) (2)
Changes relating to buy-back commitments (b) (62) (62) - 4 4 -
Changes relating to operating leases (28) (28) - - - -
Change in working capital 1,412 1,417 (5) 941 918 31
Cash from/(used in) operating activities of Discontinued Operations - - - 2,537 2,360 454
Total 5,195 5,184 55 6,110 5,884 556
C) Cash from/(used in) investing activities:
Investments in:
Property, plant and equipment and intangible assets (net of vehicles
leased out) (net of vehicles leased out) (5,528) (5,525) (3) (2,864) (2,859) (5)
Subsidiaries and other equity investments (142) (142) - (159) (160) -
Cash and cash equivalents from consolidation of Chrysler net of
consideration paid for the additional 16% ownership interest 5,624 5,624 - - - -
Proceeds from the sale of non-current assets 449 448 1 57 56 1
Net change in receivables from financing activities (1,218) 50 (1,268) (594) 6 (600)
Change in other current securities (14) 4 (18) 24 43 (19)
Other changes (29) (253) 224 150 1,302 (970)
Cash from/(used in) investing activities of Discontinued Operations ---(443) (636) (65)
Total (858) 206 (1,064) (3,829) (2,248) (1,658)
D) Cash from/(used in) financing activities:
Net change in debt and other financial assets/liabilities (1,551) (2,446) 895 (935) (1,189) 254
Change in net financial receivables from Fiat Industrial Group 2,761 2,759 2 ---
Increase in share capital 41 41 - 1 1 77
(Purchase)/sale of ownership interests in subsidiaries (c) (438) (438) - (124) (124) -
Dividends paid (181) (181) (44) (239) (239) (330)
Cash from/(used in) financing activities of Discontinued Operations - - - 2,084 1,086 998
Total 632 (265) 853 787 (465) 999
Currency translation differences 590 599 (9) 359 215 144
E) Net change in cash and cash equivalents 5,559 5,724 (165) 3,427 3,386 41
F) Cash and cash equivalents 17,526 17,429 97 15,653 14,205 1,448
of which: Cash and cash equivalents included under Assets held for sale and
Discontinued Operations - - - 3,686 2,500 1,186
G) Cash and cash equivalents at end of year 17,526 17,429 97 11,967 11,705 262
See notes on following page