Chrysler 2011 Annual Report Download - page 110
Download and view the complete annual report
Please find page 110 of the 2011 Chrysler annual report below. You can navigate through the pages in the report by either clicking on the pages listed below, or by using the keyword search tool below to find specific information within the annual report.-
 1
1 -
2
-
3
-
4
-
5
-
6
-
7
-
8
-
9
-
10
-
11
-
12
-
13
-
14
-
15
-
16
-
17
-
18
-
19
-
20
-
21
-
22
-
23
-
24
-
25
-
26
-
27
-
28
-
29
-
30
-
31
-
32
-
33
-
34
-
35
-
36
-
37
-
38
-
39
-
40
-
41
-
42
-
43
-
44
-
45
-
46
-
47
-
48
-
49
-
50
-
51
-
52
-
53
-
54
-
55
-
56
-
57
-
58
-
59
-
60
-
61
-
62
-
63
-
64
-
65
-
66
-
67
-
68
-
69
-
70
-
71
-
72
-
73
-
74
-
75
-
76
-
77
-
78
-
79
-
80
-
81
-
82
-
83
-
84
-
85
-
86
-
87
-
88
-
89
-
90
-
91
-
92
-
93
-
94
-
95
-
96
-
97
-
98
-
99
-
 100
100 -
 101
101 -
 102
102 -
 103
103 -
 104
104 -
 105
105 -
 106
106 -
 107
107 -
 108
108 -
 109
109 -
 110
110 -
 111
111 -
 112
112 -
 113
113 -
 114
114 -
 115
115 -
 116
116 -
 117
117 -
 118
118 -
 119
119 -
 120
120 -
121
-
122
-
123
-
124
-
125
-
126
-
127
-
128
-
129
-
130
-
131
-
132
-
133
-
134
-
135
-
136
-
137
-
138
-
139
-
140
-
141
-
142
-
143
-
144
-
145
-
146
-
147
-
148
-
149
-
150
-
151
-
152
-
153
-
154
-
155
-
156
-
157
-
158
-
159
-
160
-
161
-
162
-
163
-
164
-
165
-
166
-
167
-
168
-
169
-
170
-
171
-
172
-
173
-
174
-
175
-
176
-
177
-
178
-
179
-
180
-
181
-
182
-
183
-
184
-
185
-
186
-
187
-
188
-
189
-
190
-
191
-
192
-
193
-
194
-
195
-
196
-
197
-
198
-
199
-
200
-
201
-
202
-
203
-
204
-
205
-
206
-
207
-
208
-
209
-
210
-
211
-
212
-
213
-
214
-
215
-
216
-
217
-
218
-
219
-
220
-
221
-
222
-
223
-
224
-
225
-
226
-
227
-
228
-
229
-
230
-
231
-
232
-
233
-
234
-
235
-
236
-
237
-
238
-
239
-
240
-
241
-
242
-
243
-
244
-
245
-
246
-
247
-
248
-
249
-
250
-
251
-
252
-
253
-
254
-
255
-
256
-
257
-
258
-
259
-
260
-
261
-
262
-
263
-
264
-
265
-
266
-
267
-
268
-
269
-
270
-
271
-
272
-
273
-
274
-
275
-
276
-
277
-
278
-
279
-
280
-
281
-
282
-
283
-
284
-
285
-
286
-
287
-
288
-
289
-
290
-
291
-
292
-
293
-
294
-
295
-
296
-
297
-
298
-
299
-
300
-
301
-
302
-
303
-
304
-
305
-
306
-
307
-
308
-
309
-
310
-
311
-
312
-
313
-
314
-
315
-
316
-
317
-
318
-
319
-
320
-
321
-
322
-
323
-
324
-
325
-
326
-
327
-
328
-
329
-
330
-
331
-
332
-
333
-
334
-
335
-
336
-
337
-
338
-
339
-
340
-
341
-
342
-
343
-
344
-
345
-
346
-
347
-
348
-
349
-
350
-
351
-
352
-
353
-
354
-
355
-
356
-
357
-
358
-
359
-
360
-
361
-
362
-
363
-
364
-
365
-
366
-
367
-
368
-
369
-
370
-
371
-
372
-
373
-
374
-
375
-
376
-
377
-
378
-
379
-
380
-
381
-
382
-
383
-
384
-
385
-
386
-
387
-
388
-
389
-
390
-
391
-
392
-
393
-
394
-
395
-
396
-
397
-
398
-
399
-
400
-
401
-
402
 |
 |
109
Report on Operations
Maserati
Highlights
(€ million) 2011 2010
Net revenues 588 586
Trading profit/(loss) 40 24
Operating profit/(loss) (*) 40 24
Investments in tangible and intangible assets 134 104
of which capitalized R&D costs 108 60
Total R&D expenditure (**) 113 62
Vehicles shipped (units) 6,159 5,675
Employees at year end 714 696
(*) Includes restructuring costs and other unusual income/(expense)
(**) Includes capitalized R&D and R&D charged directly to the income statement
Operating Performance
Maserati closed another year with strong growth both in volumes and earnings, despite a weak economic
environment, particularly in Europe, and a continued negative trend in its core market. Steady improvement
in the U.S. market and strong demand in Asia, particularly in China, more than compensated for the decline
registered in Europe.
In 2011, Maserati shipped a total of 6,159 vehicles, posting revenues of €588 million and trading profit of €40
million (trading margin 6.8%).
The U.S. remained Maserati’s no. 1 market, with shipments up 20% over the prior year to 2,437 vehicles, and
China became the brand’s second largest market, with shipments nearly doubling to 842 vehicles. Japan also
recorded strong growth with a 22% increase for the year. By contrast, shipments in Europe were down 21%
over the 2010 level to 1,519 vehicles. In other markets, Maserati recorded an overall increase of 4%. The order
backlog at year end stood at 570 vehicles.
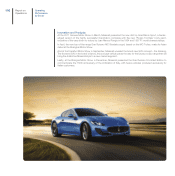
On the back of the highly successful MC Stradale version, sales for the Maserati GranTurismo reached 2,846
vehicles, representing a 27% increase over the prior year. The Quattroporte luxury sport sedan continued to
perform well in 2011 with 1,665 vehicles sold (+15% over 2010). For the GranCabrio, sales were down 16% for
the year to 1,648 vehicles.
In motor sport, following its departure from the FIA GT1 World Championship, where it took the Driver and Team
titles in 2010, the sector concentrated its efforts on the Trofeo Maserati. In its second season, this single-make
championship (which features the GranTurismo MC Trofeo, the racing version of the GranTurismo S) attracted
increasing interest and participation from Maserati fans. During 2011, the Maserati Quattroporte Evo made its
debut in the Superstars Series and went on to win the title.
In October, Maserati and Giovanni Soldini sealed a partnership that will see the famous Italian sailor attempting
to break 3 ocean sailing records in a state-of-the-art yacht bearing the Maserati name.