Chrysler 2011 Annual Report Download - page 74
Download and view the complete annual report
Please find page 74 of the 2011 Chrysler annual report below. You can navigate through the pages in the report by either clicking on the pages listed below, or by using the keyword search tool below to find specific information within the annual report.-
 1
1 -
2
-
3
-
4
-
5
-
6
-
7
-
8
-
9
-
10
-
11
-
12
-
13
-
14
-
15
-
16
-
17
-
18
-
19
-
20
-
21
-
22
-
23
-
24
-
25
-
26
-
27
-
28
-
29
-
30
-
31
-
32
-
33
-
34
-
35
-
36
-
37
-
38
-
39
-
40
-
41
-
42
-
43
-
44
-
45
-
46
-
47
-
48
-
49
-
50
-
51
-
52
-
53
-
54
-
55
-
56
-
57
-
58
-
59
-
60
-
61
-
62
-
63
-
 64
64 -
 65
65 -
 66
66 -
 67
67 -
 68
68 -
 69
69 -
 70
70 -
 71
71 -
 72
72 -
 73
73 -
 74
74 -
 75
75 -
 76
76 -
 77
77 -
 78
78 -
 79
79 -
 80
80 -
 81
81 -
 82
82 -
 83
83 -
 84
84 -
85
-
86
-
87
-
88
-
89
-
90
-
91
-
92
-
93
-
94
-
95
-
96
-
97
-
98
-
99
-
100
-
101
-
102
-
103
-
104
-
105
-
106
-
107
-
108
-
109
-
110
-
111
-
112
-
113
-
114
-
115
-
116
-
117
-
118
-
119
-
120
-
121
-
122
-
123
-
124
-
125
-
126
-
127
-
128
-
129
-
130
-
131
-
132
-
133
-
134
-
135
-
136
-
137
-
138
-
139
-
140
-
141
-
142
-
143
-
144
-
145
-
146
-
147
-
148
-
149
-
150
-
151
-
152
-
153
-
154
-
155
-
156
-
157
-
158
-
159
-
160
-
161
-
162
-
163
-
164
-
165
-
166
-
167
-
168
-
169
-
170
-
171
-
172
-
173
-
174
-
175
-
176
-
177
-
178
-
179
-
180
-
181
-
182
-
183
-
184
-
185
-
186
-
187
-
188
-
189
-
190
-
191
-
192
-
193
-
194
-
195
-
196
-
197
-
198
-
199
-
200
-
201
-
202
-
203
-
204
-
205
-
206
-
207
-
208
-
209
-
210
-
211
-
212
-
213
-
214
-
215
-
216
-
217
-
218
-
219
-
220
-
221
-
222
-
223
-
224
-
225
-
226
-
227
-
228
-
229
-
230
-
231
-
232
-
233
-
234
-
235
-
236
-
237
-
238
-
239
-
240
-
241
-
242
-
243
-
244
-
245
-
246
-
247
-
248
-
249
-
250
-
251
-
252
-
253
-
254
-
255
-
256
-
257
-
258
-
259
-
260
-
261
-
262
-
263
-
264
-
265
-
266
-
267
-
268
-
269
-
270
-
271
-
272
-
273
-
274
-
275
-
276
-
277
-
278
-
279
-
280
-
281
-
282
-
283
-
284
-
285
-
286
-
287
-
288
-
289
-
290
-
291
-
292
-
293
-
294
-
295
-
296
-
297
-
298
-
299
-
300
-
301
-
302
-
303
-
304
-
305
-
306
-
307
-
308
-
309
-
310
-
311
-
312
-
313
-
314
-
315
-
316
-
317
-
318
-
319
-
320
-
321
-
322
-
323
-
324
-
325
-
326
-
327
-
328
-
329
-
330
-
331
-
332
-
333
-
334
-
335
-
336
-
337
-
338
-
339
-
340
-
341
-
342
-
343
-
344
-
345
-
346
-
347
-
348
-
349
-
350
-
351
-
352
-
353
-
354
-
355
-
356
-
357
-
358
-
359
-
360
-
361
-
362
-
363
-
364
-
365
-
366
-
367
-
368
-
369
-
370
-
371
-
372
-
373
-
374
-
375
-
376
-
377
-
378
-
379
-
380
-
381
-
382
-
383
-
384
-
385
-
386
-
387
-
388
-
389
-
390
-
391
-
392
-
393
-
394
-
395
-
396
-
397
-
398
-
399
-
400
-
401
-
402
 |
 |

73
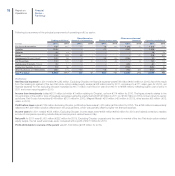
Following is a review of net revenues and trading profit by individual business/sector. All other data relates to the consolidated group.
Net revenues
Net revenues for the Group for 2011 totaled €59.6 billion. Fiat Group Automobiles (FGA) posted revenues of approximately €28 billion, in line with 2010,
with 2,032,900 passenger cars and light commercial vehicles shipped (-2.4% over the prior year). The 7.6% increase in light commercial vehicle volumes for
the year did not fully offset the 4.6% decline in passenger car shipments, which were impacted by continuing weak demand in Italy. In Brazil, FGA shipped
a record total of 772,700 vehicles, representing an increase of 1.5% over 2010.
Chrysler reported revenues of €23.6 billion for the 7 months from June-December on worldwide vehicle shipments of 1,190,000 (2,011,000 for the full
year, up 26% year-over-year).
For Luxury and Performance brands, Ferrari posted revenues of €2.3 billion, up 17.3% over 2010, while revenues for Maserati were €588 million, in line
with the prior year.
Components & Production Systems had revenues of approximately €12.0 billion, a 10.1% increase over 2010, with all sectors posting solid growth for
the year. For Magneti Marelli, revenues were up 8.5% to €5.9 billion.
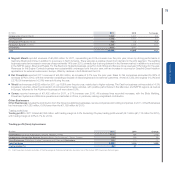
Revenues by business
(€ million) 2011 2010 % change
Automobiles (Fiat Group Automobiles, Chrysler, Maserati, Ferrari) 52,967 30,130 75.8
Components & Production Systems (Magneti Marelli, Fiat Powertrain(1), Teksid, Comau) 11,965 10,865 10.1
Other Businesses (Publishing, Holding Companies and Other) 1,083 1,159 -6.6
Eliminations (6,456) (6,274) -
Total Fiat Group 59,559 35,880 66.0
(1) Fiat Powertrain includes activities of the Passenger & Commercial Vehicles business line of the former FPT Powertrain Technologies
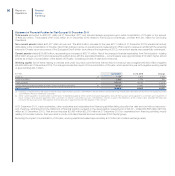
Following is a review of net revenues by business/sector:
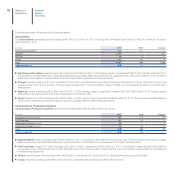
Automobiles
In 2011, the Automobiles businesses posted revenues of €52,967 million, including the contribution from Chrysler (from June) of €23,609 million.
(€ million) 2011 2010 % change
Fiat Group Automobiles 27,980 27,860 0.4
Chrysler 23,609 - -
Maserati 588 586 0.3
Ferrari 2,251 1,919 17.3
Eliminations (1,461) (235) -
Total 52,967 30,130 75.8
Fiat Group Automobiles (FGA) posted revenues of €27,980 million for the year, substantially unchanged over 2010, with a decline in volumes being
offset by a more favorable product mix.
FGA shipped2 2,032,900 passengers cars and light commercial vehicles (LCV), down 2.4% over the prior year, with the decline in passenger car volumes
being partially offset by an increase for LCVs.
(2) “Shipments”: new cars & LCVs invoiced to external customers (i.e., dealer network, importers and other customers such as rental companies, corporate fleets, government agencies
and local authorities, etc.)
Report on Operations