Chrysler 2011 Annual Report Download - page 288
Download and view the complete annual report
Please find page 288 of the 2011 Chrysler annual report below. You can navigate through the pages in the report by either clicking on the pages listed below, or by using the keyword search tool below to find specific information within the annual report.-
 1
1 -
 2
2 -
 3
3 -
 4
4 -
 5
5 -
 6
6 -
 7
7 -
 8
8 -
 9
9 -
 10
10 -
 11
11 -
 12
12 -
 13
13 -
 14
14 -
 15
15 -
 16
16 -
 17
17 -
 18
18 -
 19
19 -
 20
20 -
 21
21 -
 22
22 -
 23
23 -
 24
24 -
 25
25 -
 26
26 -
 27
27 -
 28
28 -
 29
29 -
 30
30 -
 31
31 -
 32
32 -
 33
33 -
 34
34 -
 35
35 -
 36
36 -
 37
37 -
 38
38 -
 39
39 -
 40
40 -
 41
41 -
 42
42 -
 43
43 -
 44
44 -
 45
45 -
 46
46 -
 47
47 -
 48
48 -
 49
49 -
 50
50 -
 51
51 -
 52
52 -
 53
53 -
 54
54 -
 55
55 -
 56
56 -
 57
57 -
 58
58 -
 59
59 -
 60
60 -
 61
61 -
 62
62 -
 63
63 -
 64
64 -
 65
65 -
 66
66 -
 67
67 -
 68
68 -
 69
69 -
 70
70 -
 71
71 -
 72
72 -
 73
73 -
 74
74 -
 75
75 -
 76
76 -
 77
77 -
 78
78 -
 79
79 -
 80
80 -
 81
81 -
 82
82 -
 83
83 -
 84
84 -
 85
85 -
 86
86 -
 87
87 -
 88
88 -
 89
89 -
 90
90 -
 91
91 -
 92
92 -
 93
93 -
 94
94 -
 95
95 -
 96
96 -
 97
97 -
 98
98 -
 99
99 -
 100
100 -
 101
101 -
 102
102 -
 103
103 -
 104
104 -
 105
105 -
 106
106 -
 107
107 -
 108
108 -
 109
109 -
 110
110 -
 111
111 -
 112
112 -
 113
113 -
 114
114 -
 115
115 -
 116
116 -
 117
117 -
 118
118 -
 119
119 -
 120
120 -
 121
121 -
 122
122 -
 123
123 -
 124
124 -
 125
125 -
 126
126 -
 127
127 -
 128
128 -
 129
129 -
 130
130 -
 131
131 -
 132
132 -
 133
133 -
 134
134 -
 135
135 -
 136
136 -
 137
137 -
 138
138 -
 139
139 -
 140
140 -
 141
141 -
 142
142 -
 143
143 -
 144
144 -
 145
145 -
 146
146 -
 147
147 -
 148
148 -
 149
149 -
 150
150 -
 151
151 -
 152
152 -
 153
153 -
 154
154 -
 155
155 -
 156
156 -
 157
157 -
 158
158 -
 159
159 -
 160
160 -
 161
161 -
 162
162 -
 163
163 -
 164
164 -
 165
165 -
 166
166 -
 167
167 -
 168
168 -
 169
169 -
 170
170 -
 171
171 -
 172
172 -
 173
173 -
 174
174 -
 175
175 -
 176
176 -
 177
177 -
 178
178 -
 179
179 -
 180
180 -
 181
181 -
 182
182 -
 183
183 -
 184
184 -
 185
185 -
 186
186 -
 187
187 -
 188
188 -
 189
189 -
 190
190 -
 191
191 -
 192
192 -
 193
193 -
 194
194 -
 195
195 -
 196
196 -
 197
197 -
 198
198 -
 199
199 -
 200
200 -
 201
201 -
 202
202 -
 203
203 -
 204
204 -
 205
205 -
 206
206 -
 207
207 -
 208
208 -
 209
209 -
 210
210 -
 211
211 -
 212
212 -
 213
213 -
 214
214 -
 215
215 -
 216
216 -
 217
217 -
 218
218 -
 219
219 -
 220
220 -
 221
221 -
 222
222 -
 223
223 -
 224
224 -
 225
225 -
 226
226 -
 227
227 -
 228
228 -
 229
229 -
 230
230 -
 231
231 -
 232
232 -
 233
233 -
 234
234 -
 235
235 -
 236
236 -
 237
237 -
 238
238 -
 239
239 -
 240
240 -
 241
241 -
 242
242 -
 243
243 -
 244
244 -
 245
245 -
 246
246 -
 247
247 -
 248
248 -
 249
249 -
 250
250 -
 251
251 -
 252
252 -
 253
253 -
 254
254 -
 255
255 -
 256
256 -
 257
257 -
 258
258 -
 259
259 -
 260
260 -
 261
261 -
 262
262 -
 263
263 -
 264
264 -
 265
265 -
 266
266 -
 267
267 -
 268
268 -
 269
269 -
 270
270 -
 271
271 -
 272
272 -
 273
273 -
 274
274 -
 275
275 -
 276
276 -
 277
277 -
 278
278 -
 279
279 -
 280
280 -
 281
281 -
 282
282 -
 283
283 -
 284
284 -
 285
285 -
 286
286 -
 287
287 -
 288
288 -
 289
289 -
 290
290 -
 291
291 -
 292
292 -
 293
293 -
 294
294 -
 295
295 -
 296
296 -
 297
297 -
 298
298 -
 299
299 -
 300
300 -
 301
301 -
 302
302 -
 303
303 -
 304
304 -
 305
305 -
 306
306 -
 307
307 -
 308
308 -
 309
309 -
 310
310 -
 311
311 -
 312
312 -
 313
313 -
 314
314 -
 315
315 -
 316
316 -
 317
317 -
 318
318 -
 319
319 -
 320
320 -
 321
321 -
 322
322 -
 323
323 -
 324
324 -
 325
325 -
 326
326 -
 327
327 -
 328
328 -
 329
329 -
 330
330 -
 331
331 -
 332
332 -
 333
333 -
 334
334 -
 335
335 -
 336
336 -
 337
337 -
 338
338 -
 339
339 -
 340
340 -
 341
341 -
 342
342 -
 343
343 -
 344
344 -
 345
345 -
 346
346 -
 347
347 -
 348
348 -
 349
349 -
 350
350 -
 351
351 -
 352
352 -
 353
353 -
 354
354 -
 355
355 -
 356
356 -
 357
357 -
 358
358 -
 359
359 -
 360
360 -
 361
361 -
 362
362 -
 363
363 -
 364
364 -
 365
365 -
 366
366 -
 367
367 -
 368
368 -
 369
369 -
 370
370 -
 371
371 -
 372
372 -
 373
373 -
 374
374 -
 375
375 -
 376
376 -
 377
377 -
 378
378 -
 379
379 -
 380
380 -
 381
381 -
 382
382 -
 383
383 -
 384
384 -
 385
385 -
 386
386 -
 387
387 -
 388
388 -
 389
389 -
 390
390 -
 391
391 -
 392
392 -
 393
393 -
 394
394 -
 395
395 -
 396
396 -
 397
397 -
 398
398 -
 399
399 -
 400
400 -
 401
401 -
 402
402
 |
 |

287
Fiat S.p.A. - Statutory
Financial Statements
at 31 December 2011
The permanent differences referred to above include, among other things, the tax effect of non-taxable income amounting to €198,735 thousand in 2011
(€183,506 thousand in 2010) and of non-deductible costs amounting to €64,783 thousand in 2011 (€34,917 thousand in 2010). In particular, for 2011 the
tax effect of non-taxable income was principally attributable to dividends (€101,408 thousand vs. €112,004 thousand in 2010) and impairment reversals
on investments (€96,815 thousand). Non-deductible costs principally included impairment losses on investments whose tax effect was €53,515 thousand
(€28,682 thousand in 2010).
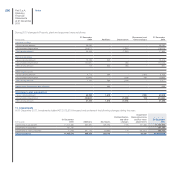
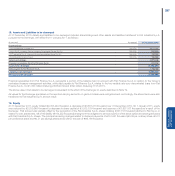
A breakdown of deferred tax liabilities, net of deferred tax assets, is provided in the following table:
(€ thousand)
31 December
2010
Recognized
in income
statement
Charged to
equity
31 December
2011
Deferred tax assets arising from:
- Taxed provisions and other minor differences 7,785 22,310 - 30,095
Total deferred tax assets 7,785 22,310 - 30,095
Deferred tax liabilities arising from:
- Measurement of construction contracts by the percentage completion method (47,010) (1,347) - (48,357)
- Others (385) (399) - (784)
Total deferred tax liabilities (47,395) (1,746) - (49,141)
Theoretical tax benefit arising from tax loss carryforwards 59,842 79,056 - 138,898
Adjustments for assets whose recoverability is not probable (27,232) (100,765) - (127,997)
Total deferred tax liabilities, net of deferred tax assets (7,000) (1,145) - (8,145)
Determination of deferred tax assets is based on an analysis of the existence of the conditions for their future realization, using updated strategic plans
and related tax plans. As a consequence, the total theoretical future tax benefit arising from deductible temporary differences (€30,095 thousand at 31
December 2011 and €7,785 thousand at 31 December 2010) and tax loss carryforwards (€138,898 thousand at 31 December 2011 and €59,842
thousand at 31 December 2010) was reduced by €127,997 thousand at 31 December 2011 (€27,232 thousand at 31 December 2010).
Total temporary differences (deductible and taxable) and tax losses at 31 December 2011 and amounts for which deferred tax assets have not been
recognized, broken down by year of expiry, are as follows:
Year of expiry
(€ thousand)
Total at
31 December
2011 2012 2013 2014 2015
Beyond
2015
Non-expiring/
undeterminable
Temporary differences and tax losses relating to IRES:
- Deductible temporary differences 109,437 26,688 687 50,041 687 31,334 -
- Taxable temporary differences (149,076) (146,224) - - - (2,852) -
- Tax losses 505,083 - - - - - 505,083
- Temporary differences and tax losses for which deferred tax assets have
not been recognized (465,444) - (687) (50,041) (687) (28,482) (385,547)
Temporary differences and tax losses subject to national taxation -(119,536) 119,536
Temporary differences relating to IRAP: -
- Deductible temporary differences ------ -
- Taxable temporary differences (146,225) (146,225) - - - - -
Temporary differences and tax losses subject to local taxation (146,225) (146,225) ---- -
