Chrysler 2011 Annual Report Download - page 164
Download and view the complete annual report
Please find page 164 of the 2011 Chrysler annual report below. You can navigate through the pages in the report by either clicking on the pages listed below, or by using the keyword search tool below to find specific information within the annual report.-
 1
1 -
2
-
3
-
4
-
5
-
6
-
7
-
8
-
9
-
10
-
11
-
12
-
13
-
14
-
15
-
16
-
17
-
18
-
19
-
20
-
21
-
22
-
23
-
24
-
25
-
26
-
27
-
28
-
29
-
30
-
31
-
32
-
33
-
34
-
35
-
36
-
37
-
38
-
39
-
40
-
41
-
42
-
43
-
44
-
45
-
46
-
47
-
48
-
49
-
50
-
51
-
52
-
53
-
54
-
55
-
56
-
57
-
58
-
59
-
60
-
61
-
62
-
63
-
64
-
65
-
66
-
67
-
68
-
69
-
70
-
71
-
72
-
73
-
74
-
75
-
76
-
77
-
78
-
79
-
80
-
81
-
82
-
83
-
84
-
85
-
86
-
87
-
88
-
89
-
90
-
91
-
92
-
93
-
94
-
95
-
96
-
97
-
98
-
99
-
100
-
101
-
102
-
103
-
104
-
105
-
106
-
107
-
108
-
109
-
110
-
111
-
112
-
113
-
114
-
115
-
116
-
117
-
118
-
119
-
120
-
121
-
122
-
123
-
124
-
125
-
126
-
127
-
128
-
129
-
130
-
131
-
132
-
133
-
134
-
135
-
136
-
137
-
138
-
139
-
140
-
141
-
142
-
143
-
144
-
145
-
146
-
147
-
148
-
149
-
150
-
151
-
152
-
153
-
 154
154 -
 155
155 -
 156
156 -
 157
157 -
 158
158 -
 159
159 -
 160
160 -
 161
161 -
 162
162 -
 163
163 -
 164
164 -
 165
165 -
 166
166 -
 167
167 -
 168
168 -
 169
169 -
 170
170 -
 171
171 -
 172
172 -
 173
173 -
 174
174 -
175
-
176
-
177
-
178
-
179
-
180
-
181
-
182
-
183
-
184
-
185
-
186
-
187
-
188
-
189
-
190
-
191
-
192
-
193
-
194
-
195
-
196
-
197
-
198
-
199
-
200
-
201
-
202
-
203
-
204
-
205
-
206
-
207
-
208
-
209
-
210
-
211
-
212
-
213
-
214
-
215
-
216
-
217
-
218
-
219
-
220
-
221
-
222
-
223
-
224
-
225
-
226
-
227
-
228
-
229
-
230
-
231
-
232
-
233
-
234
-
235
-
236
-
237
-
238
-
239
-
240
-
241
-
242
-
243
-
244
-
245
-
246
-
247
-
248
-
249
-
250
-
251
-
252
-
253
-
254
-
255
-
256
-
257
-
258
-
259
-
260
-
261
-
262
-
263
-
264
-
265
-
266
-
267
-
268
-
269
-
270
-
271
-
272
-
273
-
274
-
275
-
276
-
277
-
278
-
279
-
280
-
281
-
282
-
283
-
284
-
285
-
286
-
287
-
288
-
289
-
290
-
291
-
292
-
293
-
294
-
295
-
296
-
297
-
298
-
299
-
300
-
301
-
302
-
303
-
304
-
305
-
306
-
307
-
308
-
309
-
310
-
311
-
312
-
313
-
314
-
315
-
316
-
317
-
318
-
319
-
320
-
321
-
322
-
323
-
324
-
325
-
326
-
327
-
328
-
329
-
330
-
331
-
332
-
333
-
334
-
335
-
336
-
337
-
338
-
339
-
340
-
341
-
342
-
343
-
344
-
345
-
346
-
347
-
348
-
349
-
350
-
351
-
352
-
353
-
354
-
355
-
356
-
357
-
358
-
359
-
360
-
361
-
362
-
363
-
364
-
365
-
366
-
367
-
368
-
369
-
370
-
371
-
372
-
373
-
374
-
375
-
376
-
377
-
378
-
379
-
380
-
381
-
382
-
383
-
384
-
385
-
386
-
387
-
388
-
389
-
390
-
391
-
392
-
393
-
394
-
395
-
396
-
397
-
398
-
399
-
400
-
401
-
402
 |
 |

163
Consolidated
Financial Statements
at 31 December 2011
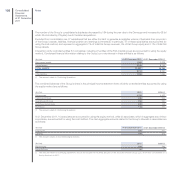
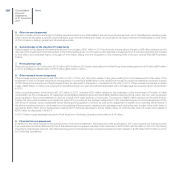
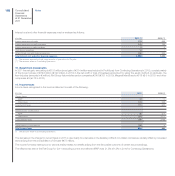
Composition and principal changes
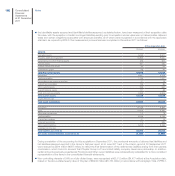
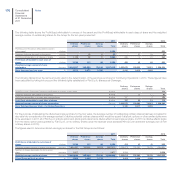
1. Net revenues
Net revenues may be analysed as follows:
(€ million) 2011 (*) 2010 (**)
Sales of goods 55,751 32,752
Rendering of services 2,140 2,163
Contract revenues 977 708
Lease instalments for assets sold with a buy-back commitment and for operating leases 255 45
Interest income from customers and other financial income of financial services companies 235 186
Other 201 25
Total Net revenues 59,559 35,880
(*) The amounts reported include seven months of operations for Chrysler.
(**) The amounts relate to Continuing Operations.
2. Cost of sales
Cost of sales comprises the following:
(€ million) 2011 (*) 2010 (**)
Costs of sales 50,556 30,611
Interest cost and other financial expenses from financial services companies 148 107
Total Cost of sales 50,704 30,718
(*) The amounts reported include seven months of operations for Chrysler.
(**) The amounts relate to Continuing Operations.
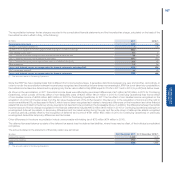
3. Selling, general and administrative costs
Selling costs amount to €3,264 million in 2011 (€1,812 million included in Profit/(loss) from Continuing Operations in 2010) and mainly consist of marketing,
advertising, and sales personnel costs.
General and administrative costs amount to €1,783 million in 2011 (€1,144 million included in the Profit (loss) from Continuing Operations in 2010) and
mainly consist of administration expenses which are not attributable to sales, manufacturing or research and development functions.
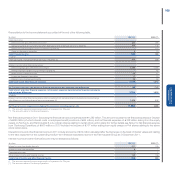
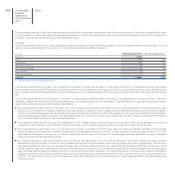
4. Research and development costs
In 2011, the breakdown of Research and development costs is as follows:
(€ million) 2011 (*) 2010 (**)
Research and development costs not recognised as assets 737 398
Amortisation of capitalised development costs 626 576
Write-down of costs previously capitalised 439
Total Research and development costs 1,367 1,013
(*) The amounts reported include seven months of operations for Chrysler.
(**) The amounts relate to Continuing Operations.
During 2011 the Group capitalised development costs of €1,438 million (€886 million capitalised from businesses included in the Continuing Operations
in 2010).