Chrysler 2011 Annual Report Download - page 103
Download and view the complete annual report
Please find page 103 of the 2011 Chrysler annual report below. You can navigate through the pages in the report by either clicking on the pages listed below, or by using the keyword search tool below to find specific information within the annual report.-
 1
1 -
2
-
3
-
4
-
5
-
6
-
7
-
8
-
9
-
10
-
11
-
12
-
13
-
14
-
15
-
16
-
17
-
18
-
19
-
20
-
21
-
22
-
23
-
24
-
25
-
26
-
27
-
28
-
29
-
30
-
31
-
32
-
33
-
34
-
35
-
36
-
37
-
38
-
39
-
40
-
41
-
42
-
43
-
44
-
45
-
46
-
47
-
48
-
49
-
50
-
51
-
52
-
53
-
54
-
55
-
56
-
57
-
58
-
59
-
60
-
61
-
62
-
63
-
64
-
65
-
66
-
67
-
68
-
69
-
70
-
71
-
72
-
73
-
74
-
75
-
76
-
77
-
78
-
79
-
80
-
81
-
82
-
83
-
84
-
85
-
86
-
87
-
88
-
89
-
90
-
91
-
92
-
 93
93 -
 94
94 -
 95
95 -
 96
96 -
 97
97 -
 98
98 -
 99
99 -
 100
100 -
 101
101 -
 102
102 -
 103
103 -
 104
104 -
 105
105 -
 106
106 -
 107
107 -
 108
108 -
 109
109 -
 110
110 -
 111
111 -
 112
112 -
 113
113 -
114
-
115
-
116
-
117
-
118
-
119
-
120
-
121
-
122
-
123
-
124
-
125
-
126
-
127
-
128
-
129
-
130
-
131
-
132
-
133
-
134
-
135
-
136
-
137
-
138
-
139
-
140
-
141
-
142
-
143
-
144
-
145
-
146
-
147
-
148
-
149
-
150
-
151
-
152
-
153
-
154
-
155
-
156
-
157
-
158
-
159
-
160
-
161
-
162
-
163
-
164
-
165
-
166
-
167
-
168
-
169
-
170
-
171
-
172
-
173
-
174
-
175
-
176
-
177
-
178
-
179
-
180
-
181
-
182
-
183
-
184
-
185
-
186
-
187
-
188
-
189
-
190
-
191
-
192
-
193
-
194
-
195
-
196
-
197
-
198
-
199
-
200
-
201
-
202
-
203
-
204
-
205
-
206
-
207
-
208
-
209
-
210
-
211
-
212
-
213
-
214
-
215
-
216
-
217
-
218
-
219
-
220
-
221
-
222
-
223
-
224
-
225
-
226
-
227
-
228
-
229
-
230
-
231
-
232
-
233
-
234
-
235
-
236
-
237
-
238
-
239
-
240
-
241
-
242
-
243
-
244
-
245
-
246
-
247
-
248
-
249
-
250
-
251
-
252
-
253
-
254
-
255
-
256
-
257
-
258
-
259
-
260
-
261
-
262
-
263
-
264
-
265
-
266
-
267
-
268
-
269
-
270
-
271
-
272
-
273
-
274
-
275
-
276
-
277
-
278
-
279
-
280
-
281
-
282
-
283
-
284
-
285
-
286
-
287
-
288
-
289
-
290
-
291
-
292
-
293
-
294
-
295
-
296
-
297
-
298
-
299
-
300
-
301
-
302
-
303
-
304
-
305
-
306
-
307
-
308
-
309
-
310
-
311
-
312
-
313
-
314
-
315
-
316
-
317
-
318
-
319
-
320
-
321
-
322
-
323
-
324
-
325
-
326
-
327
-
328
-
329
-
330
-
331
-
332
-
333
-
334
-
335
-
336
-
337
-
338
-
339
-
340
-
341
-
342
-
343
-
344
-
345
-
346
-
347
-
348
-
349
-
350
-
351
-
352
-
353
-
354
-
355
-
356
-
357
-
358
-
359
-
360
-
361
-
362
-
363
-
364
-
365
-
366
-
367
-
368
-
369
-
370
-
371
-
372
-
373
-
374
-
375
-
376
-
377
-
378
-
379
-
380
-
381
-
382
-
383
-
384
-
385
-
386
-
387
-
388
-
389
-
390
-
391
-
392
-
393
-
394
-
395
-
396
-
397
-
398
-
399
-
400
-
401
-
402
 |
 |
Report on
Operations
Operating
Performance
by Sector
102
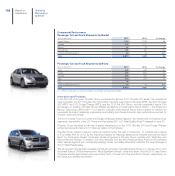
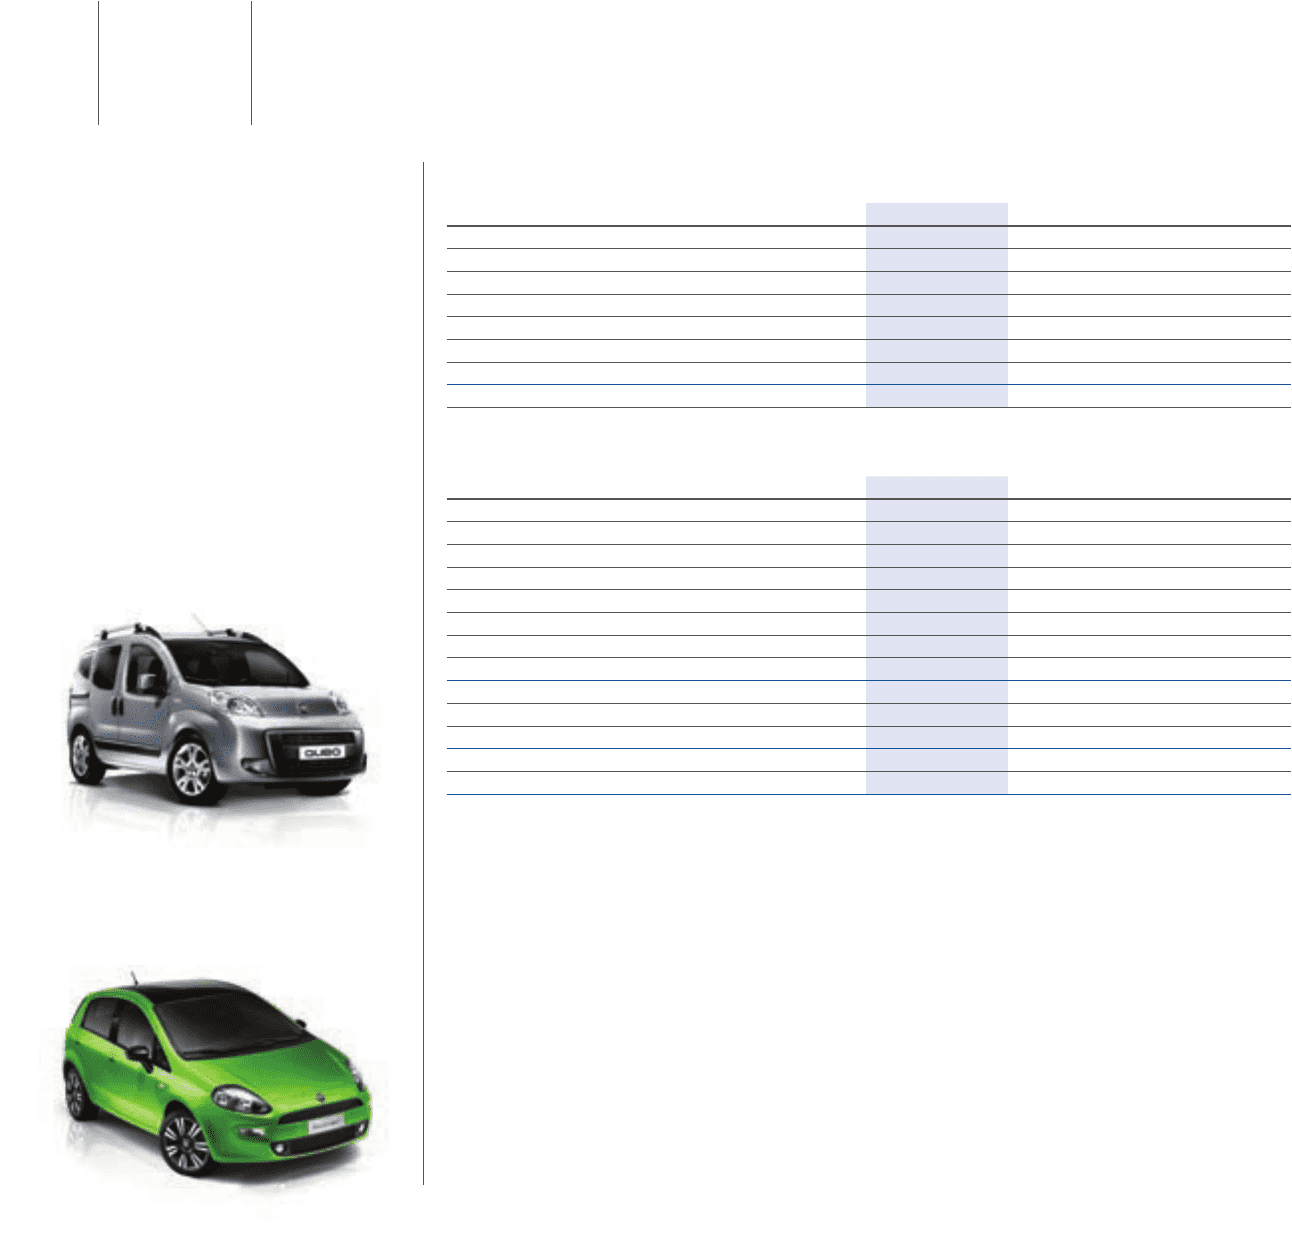
Passenger Car Market
(units in thousands) 2011 2010 % change
France 2,204.2 2,251.7 -2.1
Germany 3,173.6 2,916.3 8.8
UK 1,941.3 2,030.8 -4.4
Italy 1,748.1 1,961.6 -10.9
Spain 808.1 982.0 -17.7
Poland 277.4 315.9 -12.2
Europe (EU27+EFTA) 13,573.6 13,768.4 -1.4
Brazil 2,709.0 2,695.4 0.5
FGA
Passenger Car and LCV Shipments by Market
(units in thousands) 2011 2010 % change
France 111.1 120.9 -8.1
Germany 123.8 107.8 14.8
UK 65.8 66.4 -1.0
Italy 558.5 625.6 -10.7
Spain 30.6 37.3 -17.9
Poland 28.6 34.7 -17.6
Rest of Europe 165.3 172.8 -4.3
Europe (EU27+EFTA) 1,083.7 1.165.5 -7.0
Brazil 772.7 761.4 1.5
Rest of World 176.5 154.9 13.9
Total Sales 2,032.9 2.081.8 -2.4
Associate companies 156.9 140.5 11.7
Grand Total 2,189.7 2.222.3 -1.5
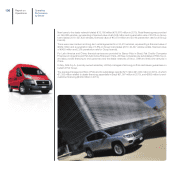
In terms of market share in Europe, FGA recorded a 6.9% share for the year, representing a 0.8 percentage
point decrease primarily attributable to the reduced weight of the Italian market and a shift in demand toward
larger vehicle segments. The contraction in demand in the A and B segments in particular (-15% and -9%,
respectively, compared to a 1.4% decline for the market overall) accounted for a 0.6 p.p. decrease in share. In
addition, 2011 saw a 73% reduction in demand for CNG and LPG vehicles in Italy, where FGA is market leader,
following on from an already significant decline in 2010.
In Italy, FGA’s share was 29.4%, down 0.9 p.p. for the year – primarily as a result of a 2.3 p.p. loss in Q1
2011 compared to Q1 2010, which benefited from the tail of eco-incentives – notwithstanding significant share
increases in its three main market segments. There were modest declines in the other major European markets,
with Germany down 0.1 p.p. to 3.1%, France -0.4 p.p. to 3.6%, the UK -0.2 p.p. to 3.0% and Spain -0.2 p.p. to
3.1%. Elsewhere in Europe, notable performance was achieved in the Netherlands, which, with approximately
37,000 vehicles sold6 and a share of 6.7%, has become FGA’s fifth largest European market.
(6) “Sales”: sales to end customers based on official, non-official and internal sources considered reliable, including the following
agencies: Italy - Ministero dei Trasporti; Brazil - Associaçao Nacional dos Fabricantes de Veiculos Automotores; France - Chambre
Syndicale; Germany - Kraftfahrzeug Bundesamt; Spain - Direccion General de Trafico; the United Kingdom - Society of Motor
Manufacturers and Traders