Chrysler 2011 Annual Report Download - page 185
Download and view the complete annual report
Please find page 185 of the 2011 Chrysler annual report below. You can navigate through the pages in the report by either clicking on the pages listed below, or by using the keyword search tool below to find specific information within the annual report.-
 1
1 -
2
-
3
-
4
-
5
-
6
-
7
-
8
-
9
-
10
-
11
-
12
-
13
-
14
-
15
-
16
-
17
-
18
-
19
-
20
-
21
-
22
-
23
-
24
-
25
-
26
-
27
-
28
-
29
-
30
-
31
-
32
-
33
-
34
-
35
-
36
-
37
-
38
-
39
-
40
-
41
-
42
-
43
-
44
-
45
-
46
-
47
-
48
-
49
-
50
-
51
-
52
-
53
-
54
-
55
-
56
-
57
-
58
-
59
-
60
-
61
-
62
-
63
-
64
-
65
-
66
-
67
-
68
-
69
-
70
-
71
-
72
-
73
-
74
-
75
-
76
-
77
-
78
-
79
-
80
-
81
-
82
-
83
-
84
-
85
-
86
-
87
-
88
-
89
-
90
-
91
-
92
-
93
-
94
-
95
-
96
-
97
-
98
-
99
-
100
-
101
-
102
-
103
-
104
-
105
-
106
-
107
-
108
-
109
-
110
-
111
-
112
-
113
-
114
-
115
-
116
-
117
-
118
-
119
-
120
-
121
-
122
-
123
-
124
-
125
-
126
-
127
-
128
-
129
-
130
-
131
-
132
-
133
-
134
-
135
-
136
-
137
-
138
-
139
-
140
-
141
-
142
-
143
-
144
-
145
-
146
-
147
-
148
-
149
-
150
-
151
-
152
-
153
-
154
-
155
-
156
-
157
-
158
-
159
-
160
-
161
-
162
-
163
-
164
-
165
-
166
-
167
-
168
-
169
-
170
-
171
-
172
-
173
-
174
-
 175
175 -
 176
176 -
 177
177 -
 178
178 -
 179
179 -
 180
180 -
 181
181 -
 182
182 -
 183
183 -
 184
184 -
 185
185 -
 186
186 -
 187
187 -
 188
188 -
 189
189 -
 190
190 -
 191
191 -
 192
192 -
 193
193 -
 194
194 -
 195
195 -
196
-
197
-
198
-
199
-
200
-
201
-
202
-
203
-
204
-
205
-
206
-
207
-
208
-
209
-
210
-
211
-
212
-
213
-
214
-
215
-
216
-
217
-
218
-
219
-
220
-
221
-
222
-
223
-
224
-
225
-
226
-
227
-
228
-
229
-
230
-
231
-
232
-
233
-
234
-
235
-
236
-
237
-
238
-
239
-
240
-
241
-
242
-
243
-
244
-
245
-
246
-
247
-
248
-
249
-
250
-
251
-
252
-
253
-
254
-
255
-
256
-
257
-
258
-
259
-
260
-
261
-
262
-
263
-
264
-
265
-
266
-
267
-
268
-
269
-
270
-
271
-
272
-
273
-
274
-
275
-
276
-
277
-
278
-
279
-
280
-
281
-
282
-
283
-
284
-
285
-
286
-
287
-
288
-
289
-
290
-
291
-
292
-
293
-
294
-
295
-
296
-
297
-
298
-
299
-
300
-
301
-
302
-
303
-
304
-
305
-
306
-
307
-
308
-
309
-
310
-
311
-
312
-
313
-
314
-
315
-
316
-
317
-
318
-
319
-
320
-
321
-
322
-
323
-
324
-
325
-
326
-
327
-
328
-
329
-
330
-
331
-
332
-
333
-
334
-
335
-
336
-
337
-
338
-
339
-
340
-
341
-
342
-
343
-
344
-
345
-
346
-
347
-
348
-
349
-
350
-
351
-
352
-
353
-
354
-
355
-
356
-
357
-
358
-
359
-
360
-
361
-
362
-
363
-
364
-
365
-
366
-
367
-
368
-
369
-
370
-
371
-
372
-
373
-
374
-
375
-
376
-
377
-
378
-
379
-
380
-
381
-
382
-
383
-
384
-
385
-
386
-
387
-
388
-
389
-
390
-
391
-
392
-
393
-
394
-
395
-
396
-
397
-
398
-
399
-
400
-
401
-
402
 |
 |

Consolidated
Financial
Statements
at 31 December
2011
Notes
184
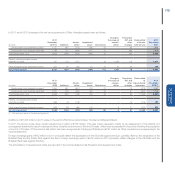
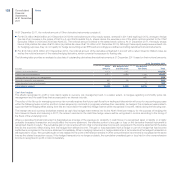
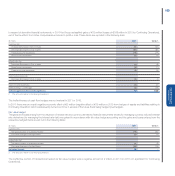
At 31 December 2011, Total Current receivables include receivables sold and financed through factoring transactions of €679 million (€533 million at 31
December 2010 for Continuing Operation) which do not meet IAS 39 derecognition requirements. These receivables are recognised as such in the Group
financial statements even though they have been legally sold; a corresponding financial liability is recorded in the consolidated statement of financial position
as Asset-backed financing (see Note 28).
Trade receivables
Trade receivables amount to €2,625 million at 31 December 2011 (€2,259 million at 31 December 2010 for Continuing Operations). The total balance
increased by €366 million over that at 31 December 2010.
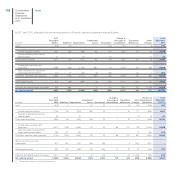
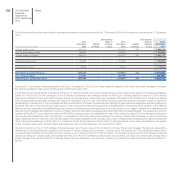
Trade receivables are shown net of allowances for doubtful accounts of €329 million at 31 December 2011 (€290 million at 31 December 2010 for
Continuing Operations). Changes in these allowances, which are calculated on the basis of historical losses on receivables, were as follows in 2011:
(€ million)
At 31
December
2010 (*) Provision
Use
and other
changes
Change in
the scope of
consolidation
At 31
December
2011
Allowances for doubtful accounts 290 82 (43) - 329
(*) The amounts relate to Continuing Operations.
The carrying amount of Trade receivables is considered in line with their fair value.
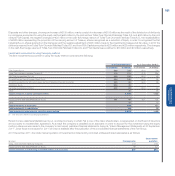
The amount of trade receivables of the Chrysler sector at 31 December 2011 is €667 million. Substantially all the trade receivables of Chrysler Group LLC
and its U.S. subsidiary guarantors are pledged as securities for debt outstanding. For the Fiat Group excluding Chrysler, trade receivables of €1 million were
pledged as security for loans obtained (€8 million at 31 December 2010 for Continuing Operations).
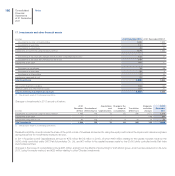
Receivables from financing activities
Receivables from financing activities include the following:
(€ million) At 31 December 2011 At 31 December 2010 (*)
Dealer financing 2,360 1,724
Retail financing 1,107 731
Finance leases 310 243
Supplier financing 51 48
Financial receivables from jointly controlled financial services entities 21 12
Financial receivables from companies under joint control, associates and unconsolidated subsidiaries 61 49
Other 58 59
Total Receivables from financing activities 3,968 2,866
(*) The amounts relate to Continuing Operations.
Receivables from financing activities increased by €1,102 million over the period. Excluding translation exchange losses of €125 million (arising mainly from
the devaluation of the Brazilian Real exchange rate against the Euro) and changes resulting from consolidation of Chrysler, totalling €15 million, the item
increased by €1,212 million, due to the increase in financing activities of the Group’s financial services companies outside Europe.
Financial receivables from jointly controlled financial services companies include current financial receivables due from the FGA Capital group.