Chrysler 2011 Annual Report Download - page 171
Download and view the complete annual report
Please find page 171 of the 2011 Chrysler annual report below. You can navigate through the pages in the report by either clicking on the pages listed below, or by using the keyword search tool below to find specific information within the annual report.-
 1
1 -
2
-
3
-
4
-
5
-
6
-
7
-
8
-
9
-
10
-
11
-
12
-
13
-
14
-
15
-
16
-
17
-
18
-
19
-
20
-
21
-
22
-
23
-
24
-
25
-
26
-
27
-
28
-
29
-
30
-
31
-
32
-
33
-
34
-
35
-
36
-
37
-
38
-
39
-
40
-
41
-
42
-
43
-
44
-
45
-
46
-
47
-
48
-
49
-
50
-
51
-
52
-
53
-
54
-
55
-
56
-
57
-
58
-
59
-
60
-
61
-
62
-
63
-
64
-
65
-
66
-
67
-
68
-
69
-
70
-
71
-
72
-
73
-
74
-
75
-
76
-
77
-
78
-
79
-
80
-
81
-
82
-
83
-
84
-
85
-
86
-
87
-
88
-
89
-
90
-
91
-
92
-
93
-
94
-
95
-
96
-
97
-
98
-
99
-
100
-
101
-
102
-
103
-
104
-
105
-
106
-
107
-
108
-
109
-
110
-
111
-
112
-
113
-
114
-
115
-
116
-
117
-
118
-
119
-
120
-
121
-
122
-
123
-
124
-
125
-
126
-
127
-
128
-
129
-
130
-
131
-
132
-
133
-
134
-
135
-
136
-
137
-
138
-
139
-
140
-
141
-
142
-
143
-
144
-
145
-
146
-
147
-
148
-
149
-
150
-
151
-
152
-
153
-
154
-
155
-
156
-
157
-
158
-
159
-
160
-
 161
161 -
 162
162 -
 163
163 -
 164
164 -
 165
165 -
 166
166 -
 167
167 -
 168
168 -
 169
169 -
 170
170 -
 171
171 -
 172
172 -
 173
173 -
 174
174 -
 175
175 -
 176
176 -
 177
177 -
 178
178 -
 179
179 -
 180
180 -
 181
181 -
182
-
183
-
184
-
185
-
186
-
187
-
188
-
189
-
190
-
191
-
192
-
193
-
194
-
195
-
196
-
197
-
198
-
199
-
200
-
201
-
202
-
203
-
204
-
205
-
206
-
207
-
208
-
209
-
210
-
211
-
212
-
213
-
214
-
215
-
216
-
217
-
218
-
219
-
220
-
221
-
222
-
223
-
224
-
225
-
226
-
227
-
228
-
229
-
230
-
231
-
232
-
233
-
234
-
235
-
236
-
237
-
238
-
239
-
240
-
241
-
242
-
243
-
244
-
245
-
246
-
247
-
248
-
249
-
250
-
251
-
252
-
253
-
254
-
255
-
256
-
257
-
258
-
259
-
260
-
261
-
262
-
263
-
264
-
265
-
266
-
267
-
268
-
269
-
270
-
271
-
272
-
273
-
274
-
275
-
276
-
277
-
278
-
279
-
280
-
281
-
282
-
283
-
284
-
285
-
286
-
287
-
288
-
289
-
290
-
291
-
292
-
293
-
294
-
295
-
296
-
297
-
298
-
299
-
300
-
301
-
302
-
303
-
304
-
305
-
306
-
307
-
308
-
309
-
310
-
311
-
312
-
313
-
314
-
315
-
316
-
317
-
318
-
319
-
320
-
321
-
322
-
323
-
324
-
325
-
326
-
327
-
328
-
329
-
330
-
331
-
332
-
333
-
334
-
335
-
336
-
337
-
338
-
339
-
340
-
341
-
342
-
343
-
344
-
345
-
346
-
347
-
348
-
349
-
350
-
351
-
352
-
353
-
354
-
355
-
356
-
357
-
358
-
359
-
360
-
361
-
362
-
363
-
364
-
365
-
366
-
367
-
368
-
369
-
370
-
371
-
372
-
373
-
374
-
375
-
376
-
377
-
378
-
379
-
380
-
381
-
382
-
383
-
384
-
385
-
386
-
387
-
388
-
389
-
390
-
391
-
392
-
393
-
394
-
395
-
396
-
397
-
398
-
399
-
400
-
401
-
402
 |
 |

Consolidated
Financial
Statements
at 31 December
2011
Notes
170
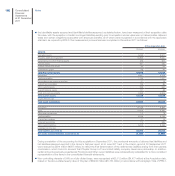
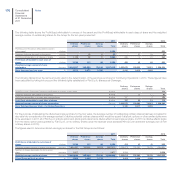
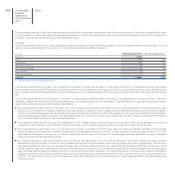
The following table shows the Profit/(loss) attributable to owners of the parent and the Profit/(loss) attributable to each class of share and the weighted
average number of outstanding shares for the Group for the two years presented:
2011 2010
Ordinary
shares
Preference
shares
Savings
shares Total
Ordinary
shares
Preference
shares
Savings
shares Total
Profit/(loss) for the period attributable to owners
of the parent € million 1,334 520
Preferred dividends declared for the period € million - 23 17 40 - 32 25 57
Profit/(loss) attributable to all classes of shares € million 1,129 88 77 1,294 433 10 20 463
Profit/(loss) attributable to each class of
shares € million 1,129 111 94 1,334 433 42 45 520
Weighted average number of shares
outstanding thousand 1,054,007 103,292 79,913 1,237,212 1,053,679 103,292 79,913 1,236,884
Basic Earnings/(loss) per share €1.071 1.071 1.180 0.410 0.410 0.565
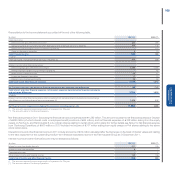
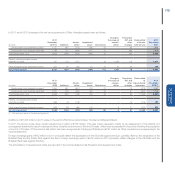
The following tables show the same amounts used in the determination of the earnings per share for Continuing Operations in 2010. These figures have
been calculated by taking into account the dividend rights established for Fiat S.p.A. shares post-Demerger.
Ordinary
shares
Preference
shares
Savings
shares Total
Profit/(loss) from Continuing Operations attributable to owners of the parent € million 179
Preferred dividends attributable for the period € million - 23 17 40
Profit/(loss) attributable to ordinary and savings shares € million 137 - 2 139
Profit/(loss) attributable to each class of shares € million 137 23 19 179
Weighted average number of shares outstanding thousand 1,053,679 103,292 79,913 1,236,884
Basic Earnings/(loss) per share – Continuing Operations €0.130 0.217 0.239
For the purpose of calculating the diluted earnings per share for the two years, the average number of outstanding ordinary shares has been increased to
also take into consideration the average number of dilutive potential ordinary shares which would be issued if all stock options or other similar rights were
to be exercised. In 2011 all of Fiat S.p.A.’s stock option and stock grant plans had a dilutive effect on earnings per share. In 2010 no dilutive effects arose
from the stock option plans granted by Fiat S.p.A. on its ordinary shares since the exercise price exceeded €10.25 per share (the average price of Fiat
ordinary shares in 2010).
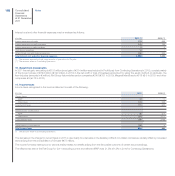
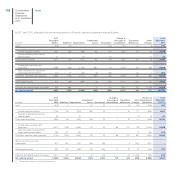
The figures used to determine diluted earnings per shares for the Fiat Group are as follows:
2011 2010
Ordinary
shares
Preference
shares
Savings
shares Total
Ordinary
shares
Preference
shares
Savings
shares Total
Profit/(Loss) attributable to each class of
shares € million 1,129 111 94 1,334 433 42 45 520
Weighted average number of shares outstanding thousand 1,054,007 103,292 79,913 1,237,212 1,053,679 103,292 79,913 1,236,884
Number of shares deployable for stock option
plans thousand 9,677 - - 9,677 5,936 - - 5,936
Weighted average number of shares thousand 1,063,684 103,292 79.913 1,246,889 1,059,615 103,292 79,913 1,242,820
Diluted Earnings/(loss) per share €1.063 1.063 1.172 0.409 0.409 0.564