Chrysler 2011 Annual Report Download - page 149
Download and view the complete annual report
Please find page 149 of the 2011 Chrysler annual report below. You can navigate through the pages in the report by either clicking on the pages listed below, or by using the keyword search tool below to find specific information within the annual report.-
 1
1 -
2
-
3
-
4
-
5
-
6
-
7
-
8
-
9
-
10
-
11
-
12
-
13
-
14
-
15
-
16
-
17
-
18
-
19
-
20
-
21
-
22
-
23
-
24
-
25
-
26
-
27
-
28
-
29
-
30
-
31
-
32
-
33
-
34
-
35
-
36
-
37
-
38
-
39
-
40
-
41
-
42
-
43
-
44
-
45
-
46
-
47
-
48
-
49
-
50
-
51
-
52
-
53
-
54
-
55
-
56
-
57
-
58
-
59
-
60
-
61
-
62
-
63
-
64
-
65
-
66
-
67
-
68
-
69
-
70
-
71
-
72
-
73
-
74
-
75
-
76
-
77
-
78
-
79
-
80
-
81
-
82
-
83
-
84
-
85
-
86
-
87
-
88
-
89
-
90
-
91
-
92
-
93
-
94
-
95
-
96
-
97
-
98
-
99
-
100
-
101
-
102
-
103
-
104
-
105
-
106
-
107
-
108
-
109
-
110
-
111
-
112
-
113
-
114
-
115
-
116
-
117
-
118
-
119
-
120
-
121
-
122
-
123
-
124
-
125
-
126
-
127
-
128
-
129
-
130
-
131
-
132
-
133
-
134
-
135
-
136
-
137
-
138
-
 139
139 -
 140
140 -
 141
141 -
 142
142 -
 143
143 -
 144
144 -
 145
145 -
 146
146 -
 147
147 -
 148
148 -
 149
149 -
 150
150 -
 151
151 -
 152
152 -
 153
153 -
 154
154 -
 155
155 -
 156
156 -
 157
157 -
 158
158 -
 159
159 -
160
-
161
-
162
-
163
-
164
-
165
-
166
-
167
-
168
-
169
-
170
-
171
-
172
-
173
-
174
-
175
-
176
-
177
-
178
-
179
-
180
-
181
-
182
-
183
-
184
-
185
-
186
-
187
-
188
-
189
-
190
-
191
-
192
-
193
-
194
-
195
-
196
-
197
-
198
-
199
-
200
-
201
-
202
-
203
-
204
-
205
-
206
-
207
-
208
-
209
-
210
-
211
-
212
-
213
-
214
-
215
-
216
-
217
-
218
-
219
-
220
-
221
-
222
-
223
-
224
-
225
-
226
-
227
-
228
-
229
-
230
-
231
-
232
-
233
-
234
-
235
-
236
-
237
-
238
-
239
-
240
-
241
-
242
-
243
-
244
-
245
-
246
-
247
-
248
-
249
-
250
-
251
-
252
-
253
-
254
-
255
-
256
-
257
-
258
-
259
-
260
-
261
-
262
-
263
-
264
-
265
-
266
-
267
-
268
-
269
-
270
-
271
-
272
-
273
-
274
-
275
-
276
-
277
-
278
-
279
-
280
-
281
-
282
-
283
-
284
-
285
-
286
-
287
-
288
-
289
-
290
-
291
-
292
-
293
-
294
-
295
-
296
-
297
-
298
-
299
-
300
-
301
-
302
-
303
-
304
-
305
-
306
-
307
-
308
-
309
-
310
-
311
-
312
-
313
-
314
-
315
-
316
-
317
-
318
-
319
-
320
-
321
-
322
-
323
-
324
-
325
-
326
-
327
-
328
-
329
-
330
-
331
-
332
-
333
-
334
-
335
-
336
-
337
-
338
-
339
-
340
-
341
-
342
-
343
-
344
-
345
-
346
-
347
-
348
-
349
-
350
-
351
-
352
-
353
-
354
-
355
-
356
-
357
-
358
-
359
-
360
-
361
-
362
-
363
-
364
-
365
-
366
-
367
-
368
-
369
-
370
-
371
-
372
-
373
-
374
-
375
-
376
-
377
-
378
-
379
-
380
-
381
-
382
-
383
-
384
-
385
-
386
-
387
-
388
-
389
-
390
-
391
-
392
-
393
-
394
-
395
-
396
-
397
-
398
-
399
-
400
-
401
-
402
 |
 |

Notes
148 Consolidated
Financial
Statements
at 31 December
2011
Actuarial gains and losses comprise the effects of differences between the previous actuarial assumptions and the actual result,
together with the effects of changes in actuarial assumptions. In measuring the defined benefit liability the Group recognises the portion
of net cumulative actuarial gains and losses that exceeds the greater of 10% of the present value of the defined benefit obligation and
10% of the fair value of plan assets at the end of the previous year. That portion is amortised over the average remaining service lives
of the employees who are covered by the plan (the “corridor method”). On IFRS first-time adoption, the Group elected to recognise all
cumulative actuarial gains and losses at 1 January 2004 even though deciding to use the corridor approach for subsequent actuarial
gains and losses.
The liability for employee benefits recognised in the statement of financial position represents the present value of the defined benefit
obligation as adjusted for deferred actuarial gains and losses arising from the application of the corridor method and unrecognised
past service cost, reduced by the fair value of plan assets. Any net asset resulting from this calculation is recognised at the lower of the
amount arising from this calculation and the total of any unrecognised net actuarial losses, unrecognised past service costs and the
present value of any refunds available and reductions in future contributions to the plan.
If changes are made to a plan that alter the benefits due for past service or if a new plan is introduced regarding past service then past
service costs are recognised in profit or loss on a straight-line basis over the average period remaining until the benefits vest. If a change
is made to a plan that significantly reduces the number of employees who are members of the plan or that alters the conditions of the
plan such that employees will no longer be entitled to the same benefits for a significant part of their future service, or if such benefits
will be reduced, the profit or loss arising from such changes is immediately recognised in the income statement.
All other costs and income arising from the measurement of pension plan provisions are allocated by function in the income statement,
except for interest cost on unfunded defined benefit plans which is reported as part of financial expenses.
Costs arising from defined contribution plans are recognised as an expense as incurred.
Share-based compensation plans
Share-based compensation plans that may be settled by the delivery of shares are measured at fair value at the grant date. This
fair value is expensed over the vesting period of the benefit with a corresponding increase in equity. Periodically, the Group reviews
its estimate of the benefits expected to vest through the plan and recognises any difference in estimate in profit or loss, with a
corresponding increase or decrease in equity.
Share-based compensation plans that may be settled in cash or by the delivery of other financial assets are recognised as a liability
and measured at fair value at the end of each reporting period and when settled. Any subsequent changes in fair value are recognised
in profit or loss.
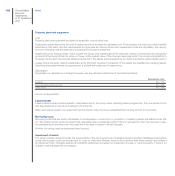
Provisions
The Group records provisions when it has an obligation, legal or constructive, to a third party, when it is probable that an outflow of
Group resources will be required to satisfy the obligation and when a reliable estimate of the amount can be made.
Changes in estimates are reflected in the income statement in the period in which the change occurs.
Treasury shares
Treasury shares are presented as a deduction from equity. The original cost of treasury shares and the proceeds of any subsequent
sale are presented as movements in equity.