Chrysler 2011 Annual Report Download - page 137
Download and view the complete annual report
Please find page 137 of the 2011 Chrysler annual report below. You can navigate through the pages in the report by either clicking on the pages listed below, or by using the keyword search tool below to find specific information within the annual report.-
 1
1 -
2
-
3
-
4
-
5
-
6
-
7
-
8
-
9
-
10
-
11
-
12
-
13
-
14
-
15
-
16
-
17
-
18
-
19
-
20
-
21
-
22
-
23
-
24
-
25
-
26
-
27
-
28
-
29
-
30
-
31
-
32
-
33
-
34
-
35
-
36
-
37
-
38
-
39
-
40
-
41
-
42
-
43
-
44
-
45
-
46
-
47
-
48
-
49
-
50
-
51
-
52
-
53
-
54
-
55
-
56
-
57
-
58
-
59
-
60
-
61
-
62
-
63
-
64
-
65
-
66
-
67
-
68
-
69
-
70
-
71
-
72
-
73
-
74
-
75
-
76
-
77
-
78
-
79
-
80
-
81
-
82
-
83
-
84
-
85
-
86
-
87
-
88
-
89
-
90
-
91
-
92
-
93
-
94
-
95
-
96
-
97
-
98
-
99
-
100
-
101
-
102
-
103
-
104
-
105
-
106
-
107
-
108
-
109
-
110
-
111
-
112
-
113
-
114
-
115
-
116
-
117
-
118
-
119
-
120
-
121
-
122
-
123
-
124
-
125
-
126
-
 127
127 -
 128
128 -
 129
129 -
 130
130 -
 131
131 -
 132
132 -
 133
133 -
 134
134 -
 135
135 -
 136
136 -
 137
137 -
 138
138 -
 139
139 -
 140
140 -
 141
141 -
 142
142 -
 143
143 -
 144
144 -
 145
145 -
 146
146 -
 147
147 -
148
-
149
-
150
-
151
-
152
-
153
-
154
-
155
-
156
-
157
-
158
-
159
-
160
-
161
-
162
-
163
-
164
-
165
-
166
-
167
-
168
-
169
-
170
-
171
-
172
-
173
-
174
-
175
-
176
-
177
-
178
-
179
-
180
-
181
-
182
-
183
-
184
-
185
-
186
-
187
-
188
-
189
-
190
-
191
-
192
-
193
-
194
-
195
-
196
-
197
-
198
-
199
-
200
-
201
-
202
-
203
-
204
-
205
-
206
-
207
-
208
-
209
-
210
-
211
-
212
-
213
-
214
-
215
-
216
-
217
-
218
-
219
-
220
-
221
-
222
-
223
-
224
-
225
-
226
-
227
-
228
-
229
-
230
-
231
-
232
-
233
-
234
-
235
-
236
-
237
-
238
-
239
-
240
-
241
-
242
-
243
-
244
-
245
-
246
-
247
-
248
-
249
-
250
-
251
-
252
-
253
-
254
-
255
-
256
-
257
-
258
-
259
-
260
-
261
-
262
-
263
-
264
-
265
-
266
-
267
-
268
-
269
-
270
-
271
-
272
-
273
-
274
-
275
-
276
-
277
-
278
-
279
-
280
-
281
-
282
-
283
-
284
-
285
-
286
-
287
-
288
-
289
-
290
-
291
-
292
-
293
-
294
-
295
-
296
-
297
-
298
-
299
-
300
-
301
-
302
-
303
-
304
-
305
-
306
-
307
-
308
-
309
-
310
-
311
-
312
-
313
-
314
-
315
-
316
-
317
-
318
-
319
-
320
-
321
-
322
-
323
-
324
-
325
-
326
-
327
-
328
-
329
-
330
-
331
-
332
-
333
-
334
-
335
-
336
-
337
-
338
-
339
-
340
-
341
-
342
-
343
-
344
-
345
-
346
-
347
-
348
-
349
-
350
-
351
-
352
-
353
-
354
-
355
-
356
-
357
-
358
-
359
-
360
-
361
-
362
-
363
-
364
-
365
-
366
-
367
-
368
-
369
-
370
-
371
-
372
-
373
-
374
-
375
-
376
-
377
-
378
-
379
-
380
-
381
-
382
-
383
-
384
-
385
-
386
-
387
-
388
-
389
-
390
-
391
-
392
-
393
-
394
-
395
-
396
-
397
-
398
-
399
-
400
-
401
-
402
 |
 |
136 Consolidated
Financial
Statements
at 31 December
2011
Income Statement
pursuant to
Consob Resolution
15519 of
27 July 2006
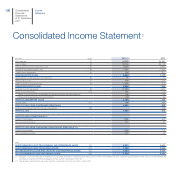
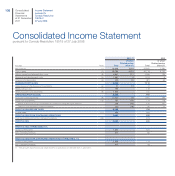
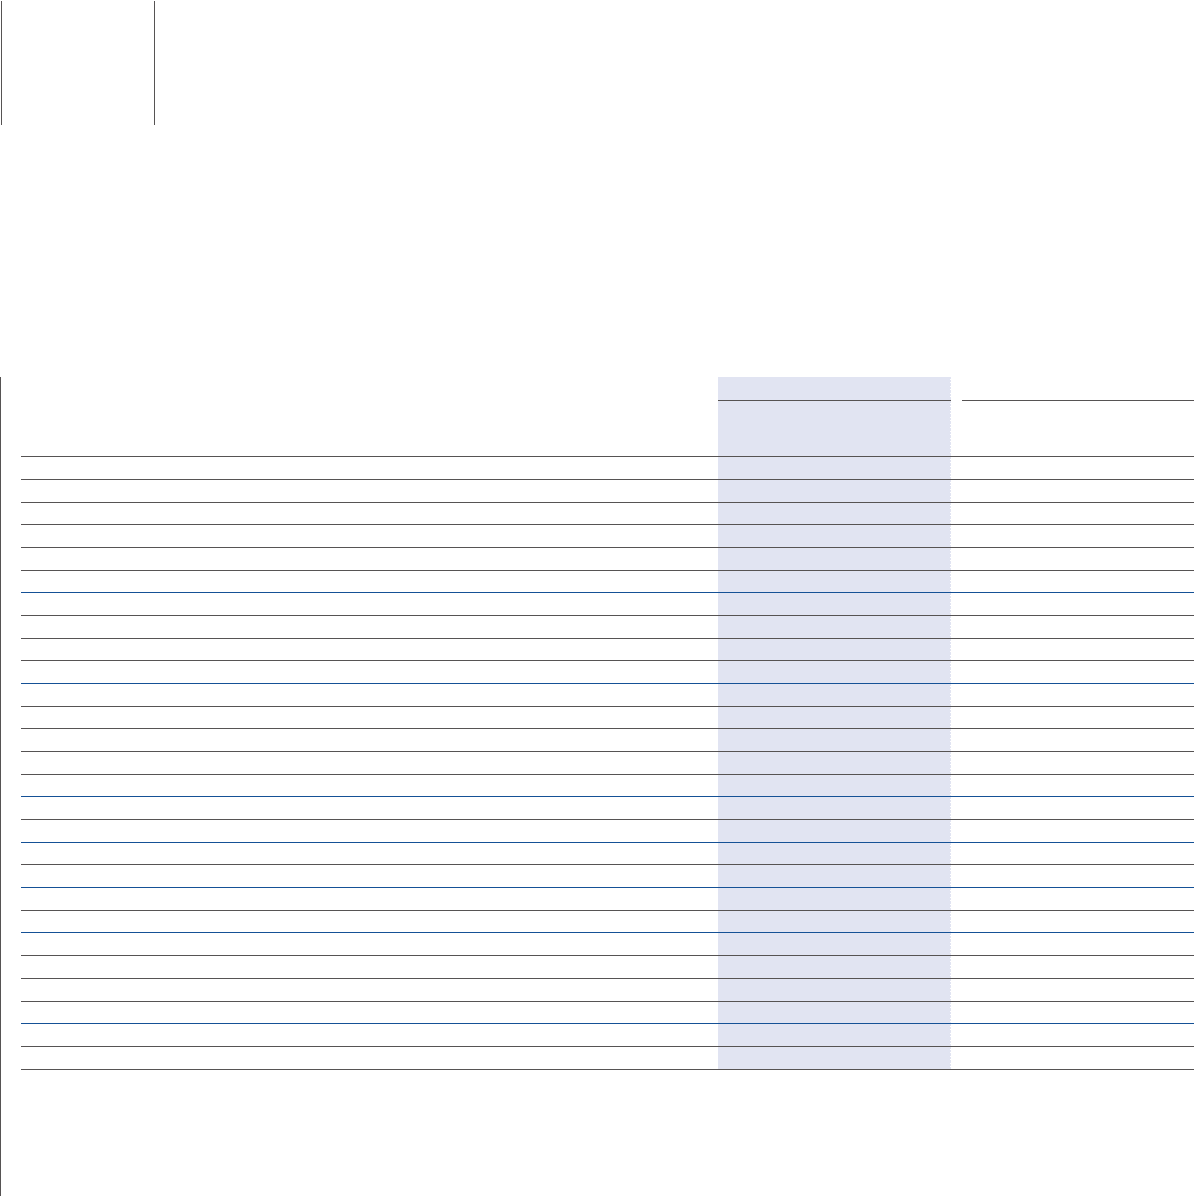
Consolidated Income Statement
pursuant to Consob Resolution 15519 of 27 July 2006
2011 (*) 2010
(€ million) Note Total
of which
Related parties
(Note 37) Total
of which
Related parties
(Note 37)
Net revenues (1) 59,559 2,970 35,880 2,586
Cost of sales (2) 50,704 4,272 30,718 3,742
Selling, general and administrative costs (3) 5,047 117 2,956 139
Research and development costs (4) 1,367 2 1,013 8
Other income (expenses) (5) (49) 35 (81) 34
TRADING PROFIT/(LOSS) 2,392 1,112
Gains (losses) on the disposal of investments (6) 21 12 12 -
Restructuring costs (7) 102 - 118 -
Other unusual income (expenses) (8) 1,025 - (14) -
OPERATING PROFIT/(LOSS) 3,336 992
Financial income (expenses) (9) (1,282) 40 (400) 188
Result from investments: (10) 131 136 114 118
Share of the profit or loss of investees accounted for using the equity method 146 146 120 120
Other income (expenses) from investments (15) (10) (6) (2)
PROFIT/(LOSS) BEFORE TAXES 2,185 706
Income taxes (11) 534 484
PROFIT/(LOSS) FROM CONTINUING OPERATIONS 1,651 222
Post-tax profit/(loss) from Discontinued Operations (23) - 378
PROFIT/(LOSS) 1,651 600
PROFIT/(LOSS) ATTRIBUTABLE TO:
Owners of the parent 1,334 520
Non-controlling interests 317 80
PROFIT/(LOSS) FROM CONTINUING OPERATIONS ATTRIBUTABLE TO:
Owners of the parent 1,334 179
Non-controlling interests 317 43
(*) The amounts reported include seven months of operations for Chrysler from 1 June 2011.