Chrysler 2011 Annual Report Download - page 179
Download and view the complete annual report
Please find page 179 of the 2011 Chrysler annual report below. You can navigate through the pages in the report by either clicking on the pages listed below, or by using the keyword search tool below to find specific information within the annual report.-
 1
1 -
2
-
3
-
4
-
5
-
6
-
7
-
8
-
9
-
10
-
11
-
12
-
13
-
14
-
15
-
16
-
17
-
18
-
19
-
20
-
21
-
22
-
23
-
24
-
25
-
26
-
27
-
28
-
29
-
30
-
31
-
32
-
33
-
34
-
35
-
36
-
37
-
38
-
39
-
40
-
41
-
42
-
43
-
44
-
45
-
46
-
47
-
48
-
49
-
50
-
51
-
52
-
53
-
54
-
55
-
56
-
57
-
58
-
59
-
60
-
61
-
62
-
63
-
64
-
65
-
66
-
67
-
68
-
69
-
70
-
71
-
72
-
73
-
74
-
75
-
76
-
77
-
78
-
79
-
80
-
81
-
82
-
83
-
84
-
85
-
86
-
87
-
88
-
89
-
90
-
91
-
92
-
93
-
94
-
95
-
96
-
97
-
98
-
99
-
100
-
101
-
102
-
103
-
104
-
105
-
106
-
107
-
108
-
109
-
110
-
111
-
112
-
113
-
114
-
115
-
116
-
117
-
118
-
119
-
120
-
121
-
122
-
123
-
124
-
125
-
126
-
127
-
128
-
129
-
130
-
131
-
132
-
133
-
134
-
135
-
136
-
137
-
138
-
139
-
140
-
141
-
142
-
143
-
144
-
145
-
146
-
147
-
148
-
149
-
150
-
151
-
152
-
153
-
154
-
155
-
156
-
157
-
158
-
159
-
160
-
161
-
162
-
163
-
164
-
165
-
166
-
167
-
168
-
 169
169 -
 170
170 -
 171
171 -
 172
172 -
 173
173 -
 174
174 -
 175
175 -
 176
176 -
 177
177 -
 178
178 -
 179
179 -
 180
180 -
 181
181 -
 182
182 -
 183
183 -
 184
184 -
 185
185 -
 186
186 -
 187
187 -
 188
188 -
 189
189 -
190
-
191
-
192
-
193
-
194
-
195
-
196
-
197
-
198
-
199
-
200
-
201
-
202
-
203
-
204
-
205
-
206
-
207
-
208
-
209
-
210
-
211
-
212
-
213
-
214
-
215
-
216
-
217
-
218
-
219
-
220
-
221
-
222
-
223
-
224
-
225
-
226
-
227
-
228
-
229
-
230
-
231
-
232
-
233
-
234
-
235
-
236
-
237
-
238
-
239
-
240
-
241
-
242
-
243
-
244
-
245
-
246
-
247
-
248
-
249
-
250
-
251
-
252
-
253
-
254
-
255
-
256
-
257
-
258
-
259
-
260
-
261
-
262
-
263
-
264
-
265
-
266
-
267
-
268
-
269
-
270
-
271
-
272
-
273
-
274
-
275
-
276
-
277
-
278
-
279
-
280
-
281
-
282
-
283
-
284
-
285
-
286
-
287
-
288
-
289
-
290
-
291
-
292
-
293
-
294
-
295
-
296
-
297
-
298
-
299
-
300
-
301
-
302
-
303
-
304
-
305
-
306
-
307
-
308
-
309
-
310
-
311
-
312
-
313
-
314
-
315
-
316
-
317
-
318
-
319
-
320
-
321
-
322
-
323
-
324
-
325
-
326
-
327
-
328
-
329
-
330
-
331
-
332
-
333
-
334
-
335
-
336
-
337
-
338
-
339
-
340
-
341
-
342
-
343
-
344
-
345
-
346
-
347
-
348
-
349
-
350
-
351
-
352
-
353
-
354
-
355
-
356
-
357
-
358
-
359
-
360
-
361
-
362
-
363
-
364
-
365
-
366
-
367
-
368
-
369
-
370
-
371
-
372
-
373
-
374
-
375
-
376
-
377
-
378
-
379
-
380
-
381
-
382
-
383
-
384
-
385
-
386
-
387
-
388
-
389
-
390
-
391
-
392
-
393
-
394
-
395
-
396
-
397
-
398
-
399
-
400
-
401
-
402
 |
 |
Consolidated
Financial
Statements
at 31 December
2011
Notes
178
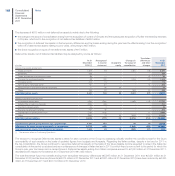
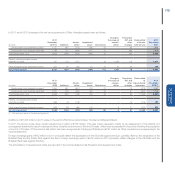
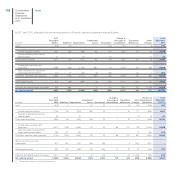
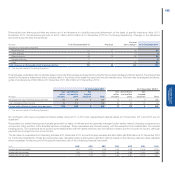
In 2011 and 2010, changes in the net carrying amount of Property, plant and equipment were as follows:
(€ million)
At 31
December
2010 (*) Additions Depreciation
Impairment
losses Divestitures
Change in
the scope of
consolidation
Translation
differences
Other
changes
At 31
December
2011
Land 365 24 - - (10) 310 21 9 719
Owned industrial buildings 1,967 235 (189) (35) (15) 1,825 131 20 3,939
Industrial buildings leased under
finance leases 47 - (2) - (1) - - (1) 43
Total Industrial buildings 2,014 235 (191) (35) (16) 1,825 131 19 3,982
Owned plant, machinery and
equipment 5,588 1,456 (1,640) (281) (4) 3,188 132 829 9,268
Plant, machinery and equipment
leased under finance leases 275 37 (30) (4) (26) - (2) 4 254
Total Plant, machinery and equipment 5,863 1,493 (1,670) (285) (30) 3,188 130 833 9,522
Other tangible assets 416 589 (684) (2) (105) 3,147 302 230 3,893
Advances and tangible assets in progress 943 1,584 - (1) (72) 1,201 122 (1,108) 2,669
Net carrying amount 9,601 3,925 (2,545) (323) (233) 9,671 706 (17) 20,785
(€ million)
At 31
December
2009 Additions Depreciation
Impairment
losses Divestitures
Change in
the scope of
consolidation
Translation
differences
Other
changes
Reclass.to
Discontinued
Operations
At 31
December
2010 (*)
Land 603 2 - (2) (2) - 13 (41) (208) 365
Owned industrial buildings 2,746 99 (182) (59) (3) 7 87 171 (899) 1,967
Industrial buildings leased under
finance leases 59 - (2) - - - - (1) (9) 47
Total Industrial buildings 2,805 99 (184) (59) (3) 7 87 170 (908) 2,014
Owned plant, machinery and
equipment 6,510 1,098 (1,548) (73) (9) 88 227 789 (1,494) 5,588
Plant, machinery and equipment
leased under finance leases 236 107 (44) - - - - 12 (36) 275
Total Plant, machinery and equipment 6,746 1,205 (1,592) (73) (9) 88 227 801 (1,530) 5,863
Assets sold with a buy-back
commitment 910 344 (131) (26) (63) - 4 (167) (871) -
Other tangible assets 504 224 (136) (3) (96) 11 20 37 (145) 416
Advances and tangible assets in progress 1,377 730 - (4) (14) 7 50 (1,009) (194) 943
Net carrying amount 12,945 2,604 (2,043) (167) (187) 113 401 (209) (3,856) 9,601
(*) The amounts relate to Continuing Operations.