Chrysler 2011 Annual Report Download - page 80
Download and view the complete annual report
Please find page 80 of the 2011 Chrysler annual report below. You can navigate through the pages in the report by either clicking on the pages listed below, or by using the keyword search tool below to find specific information within the annual report.-
 1
1 -
2
-
3
-
4
-
5
-
6
-
7
-
8
-
9
-
10
-
11
-
12
-
13
-
14
-
15
-
16
-
17
-
18
-
19
-
20
-
21
-
22
-
23
-
24
-
25
-
26
-
27
-
28
-
29
-
30
-
31
-
32
-
33
-
34
-
35
-
36
-
37
-
38
-
39
-
40
-
41
-
42
-
43
-
44
-
45
-
46
-
47
-
48
-
49
-
50
-
51
-
52
-
53
-
54
-
55
-
56
-
57
-
58
-
59
-
60
-
61
-
62
-
63
-
64
-
65
-
66
-
67
-
68
-
69
-
 70
70 -
 71
71 -
 72
72 -
 73
73 -
 74
74 -
 75
75 -
 76
76 -
 77
77 -
 78
78 -
 79
79 -
 80
80 -
 81
81 -
 82
82 -
 83
83 -
 84
84 -
 85
85 -
 86
86 -
 87
87 -
 88
88 -
 89
89 -
 90
90 -
91
-
92
-
93
-
94
-
95
-
96
-
97
-
98
-
99
-
100
-
101
-
102
-
103
-
104
-
105
-
106
-
107
-
108
-
109
-
110
-
111
-
112
-
113
-
114
-
115
-
116
-
117
-
118
-
119
-
120
-
121
-
122
-
123
-
124
-
125
-
126
-
127
-
128
-
129
-
130
-
131
-
132
-
133
-
134
-
135
-
136
-
137
-
138
-
139
-
140
-
141
-
142
-
143
-
144
-
145
-
146
-
147
-
148
-
149
-
150
-
151
-
152
-
153
-
154
-
155
-
156
-
157
-
158
-
159
-
160
-
161
-
162
-
163
-
164
-
165
-
166
-
167
-
168
-
169
-
170
-
171
-
172
-
173
-
174
-
175
-
176
-
177
-
178
-
179
-
180
-
181
-
182
-
183
-
184
-
185
-
186
-
187
-
188
-
189
-
190
-
191
-
192
-
193
-
194
-
195
-
196
-
197
-
198
-
199
-
200
-
201
-
202
-
203
-
204
-
205
-
206
-
207
-
208
-
209
-
210
-
211
-
212
-
213
-
214
-
215
-
216
-
217
-
218
-
219
-
220
-
221
-
222
-
223
-
224
-
225
-
226
-
227
-
228
-
229
-
230
-
231
-
232
-
233
-
234
-
235
-
236
-
237
-
238
-
239
-
240
-
241
-
242
-
243
-
244
-
245
-
246
-
247
-
248
-
249
-
250
-
251
-
252
-
253
-
254
-
255
-
256
-
257
-
258
-
259
-
260
-
261
-
262
-
263
-
264
-
265
-
266
-
267
-
268
-
269
-
270
-
271
-
272
-
273
-
274
-
275
-
276
-
277
-
278
-
279
-
280
-
281
-
282
-
283
-
284
-
285
-
286
-
287
-
288
-
289
-
290
-
291
-
292
-
293
-
294
-
295
-
296
-
297
-
298
-
299
-
300
-
301
-
302
-
303
-
304
-
305
-
306
-
307
-
308
-
309
-
310
-
311
-
312
-
313
-
314
-
315
-
316
-
317
-
318
-
319
-
320
-
321
-
322
-
323
-
324
-
325
-
326
-
327
-
328
-
329
-
330
-
331
-
332
-
333
-
334
-
335
-
336
-
337
-
338
-
339
-
340
-
341
-
342
-
343
-
344
-
345
-
346
-
347
-
348
-
349
-
350
-
351
-
352
-
353
-
354
-
355
-
356
-
357
-
358
-
359
-
360
-
361
-
362
-
363
-
364
-
365
-
366
-
367
-
368
-
369
-
370
-
371
-
372
-
373
-
374
-
375
-
376
-
377
-
378
-
379
-
380
-
381
-
382
-
383
-
384
-
385
-
386
-
387
-
388
-
389
-
390
-
391
-
392
-
393
-
394
-
395
-
396
-
397
-
398
-
399
-
400
-
401
-
402
 |
 |

79
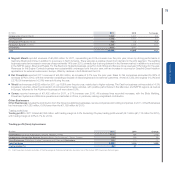
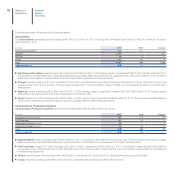
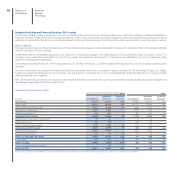
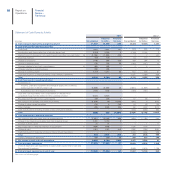
Statement of Cash Flows
Following is a summary statement of cash flows and related comments. A complete statement of cash flows is provided in the Consolidated Financial
Statements.
(€ million) 2011 2010
A) CASH AND CASH EQUIVALENTS AT BEGINNING OF YEAR 11,967 12,226
B) CASH FROM/(USED IN) OPERATING ACTIVITIES 5,195 6,110
of which: Cash and cash equivalents from operating activities of Discontinued Operations -2,537
C) CASH FROM/(USED IN) INVESTING ACTIVITIES (*) (858) (3,829)
of which: Cash and cash equivalents used in investing activities of Discontinued Operations -(443)
D) CASH FROM/(USED IN) FINANCING ACTIVITIES 632 787
of which: Cash and cash equivalents from financing activities of Discontinued Operations -2,084
Currency translation differences 590 359
E) NET CHANGE IN CASH AND CASH EQUIVALENTS 5,559 3,427
F) CASH AND CASH EQUIVALENTS 17,526 15,653
of which: Cash and cash equivalents included under Assets held for sale and Discontinued Operations -3,686
G) CASH AND CASH EQUIVALENTS AT END OF YEAR 17,526 11,967
(*) For 2011, includes €5,624 million in cash and cash equivalents from consolidation of Chrysler, net of €881 million (USD 1,268 million) paid to Chrysler for additional 16% ownership
interest. For 2010, the figure differs from the previously reported amount due to reclassification of the purchase consideration for the 5% interest in Ferrari S.p.A. to (purchases)/disposals
of ownership interests in subsidiaries (under Cash from/used in financing activities)
For 2011, cash generated by operating activities was €5,195 million, of which €1,751 million generated by Chrysler (consolidated from June 2011).
Excluding Chrysler, cash from operating activities totaled €3,444 million, of which €2,236 million was attributable to income-related cash inflows (i.e., net
profit plus amortization and depreciation, dividends, changes in provisions and various items related to vehicles sold under buy-back commitments, net of
gains/losses on disposals and other non-cash items) and €1,208 million to a decrease in working capital (at constant exchange rates).
Investing activities absorbed €858 million in cash, of which cash held by Chrysler at consolidation totaled €5,624 million (net of €881 million paid to
Chrysler for a 16% ownership interest). Excluding the impact of initial consolidation of Chrysler, investing activities absorbed a total of €6,482 million in cash.
Expenditure on tangible and intangible assets (including €1,438 million in capitalized development costs) totaled €5,528 million (of which €1,936 million
related to Chrysler for the period June-December).
Investments in subsidiaries and other equity interests of €142 million related primarily to the recapitalization of GAC Fiat Automobiles Co. Ltd. (a 50/50 JV
in China) and Fiat India Automobiles Limited (a 50/50 JV in India), as well as the acquisition of a 50% interest in VM Motori S.p.A.
Proceeds from the sale of non-current assets totaled €449 million for 2011, of which €252 million related to Chrysler (principally for disposals of tangible
and intangible assets). Excluding Chrysler, the amount related to the sale (in 2010) of FGA’s 49% interest in Iveco Latin America Ltda. and Fiat S.p.A.’s 100%
interest in Fiat Switzerland SA (both to Fiat Industrial), in addition to disposals of various fixed assets.
The increase in receivables from financing activities of €1,218 million largely related to FGA’s financial services companies in Latin America.
Financing activities generated approximately €0.6 billion in cash. Cash from financing activities – including €2.8 billion received from Fiat Industrial
for net financial receivables outstanding at 31 December 2010 and €2.5 billion in bond proceeds – was partially offset by repayment of €2.4 billion in
bond maturities, the net reduction of approximately €1.7 billion in debt (including transfer of approximately €1 billion in credit lines to Fiat Industrial as a
consequence of the Demerger), payment of €181 million in dividends (almost entirely to Fiat shareholders and minority shareholders of subsidiaries) and
€438 million for the purchase of the ownership interests held in Chrysler by the U.S. Treasury and Canada.
Report on Operations