Chrysler 2011 Annual Report Download - page 148
Download and view the complete annual report
Please find page 148 of the 2011 Chrysler annual report below. You can navigate through the pages in the report by either clicking on the pages listed below, or by using the keyword search tool below to find specific information within the annual report.-
 1
1 -
2
-
3
-
4
-
5
-
6
-
7
-
8
-
9
-
10
-
11
-
12
-
13
-
14
-
15
-
16
-
17
-
18
-
19
-
20
-
21
-
22
-
23
-
24
-
25
-
26
-
27
-
28
-
29
-
30
-
31
-
32
-
33
-
34
-
35
-
36
-
37
-
38
-
39
-
40
-
41
-
42
-
43
-
44
-
45
-
46
-
47
-
48
-
49
-
50
-
51
-
52
-
53
-
54
-
55
-
56
-
57
-
58
-
59
-
60
-
61
-
62
-
63
-
64
-
65
-
66
-
67
-
68
-
69
-
70
-
71
-
72
-
73
-
74
-
75
-
76
-
77
-
78
-
79
-
80
-
81
-
82
-
83
-
84
-
85
-
86
-
87
-
88
-
89
-
90
-
91
-
92
-
93
-
94
-
95
-
96
-
97
-
98
-
99
-
100
-
101
-
102
-
103
-
104
-
105
-
106
-
107
-
108
-
109
-
110
-
111
-
112
-
113
-
114
-
115
-
116
-
117
-
118
-
119
-
120
-
121
-
122
-
123
-
124
-
125
-
126
-
127
-
128
-
129
-
130
-
131
-
132
-
133
-
134
-
135
-
136
-
137
-
 138
138 -
 139
139 -
 140
140 -
 141
141 -
 142
142 -
 143
143 -
 144
144 -
 145
145 -
 146
146 -
 147
147 -
 148
148 -
 149
149 -
 150
150 -
 151
151 -
 152
152 -
 153
153 -
 154
154 -
 155
155 -
 156
156 -
 157
157 -
 158
158 -
159
-
160
-
161
-
162
-
163
-
164
-
165
-
166
-
167
-
168
-
169
-
170
-
171
-
172
-
173
-
174
-
175
-
176
-
177
-
178
-
179
-
180
-
181
-
182
-
183
-
184
-
185
-
186
-
187
-
188
-
189
-
190
-
191
-
192
-
193
-
194
-
195
-
196
-
197
-
198
-
199
-
200
-
201
-
202
-
203
-
204
-
205
-
206
-
207
-
208
-
209
-
210
-
211
-
212
-
213
-
214
-
215
-
216
-
217
-
218
-
219
-
220
-
221
-
222
-
223
-
224
-
225
-
226
-
227
-
228
-
229
-
230
-
231
-
232
-
233
-
234
-
235
-
236
-
237
-
238
-
239
-
240
-
241
-
242
-
243
-
244
-
245
-
246
-
247
-
248
-
249
-
250
-
251
-
252
-
253
-
254
-
255
-
256
-
257
-
258
-
259
-
260
-
261
-
262
-
263
-
264
-
265
-
266
-
267
-
268
-
269
-
270
-
271
-
272
-
273
-
274
-
275
-
276
-
277
-
278
-
279
-
280
-
281
-
282
-
283
-
284
-
285
-
286
-
287
-
288
-
289
-
290
-
291
-
292
-
293
-
294
-
295
-
296
-
297
-
298
-
299
-
300
-
301
-
302
-
303
-
304
-
305
-
306
-
307
-
308
-
309
-
310
-
311
-
312
-
313
-
314
-
315
-
316
-
317
-
318
-
319
-
320
-
321
-
322
-
323
-
324
-
325
-
326
-
327
-
328
-
329
-
330
-
331
-
332
-
333
-
334
-
335
-
336
-
337
-
338
-
339
-
340
-
341
-
342
-
343
-
344
-
345
-
346
-
347
-
348
-
349
-
350
-
351
-
352
-
353
-
354
-
355
-
356
-
357
-
358
-
359
-
360
-
361
-
362
-
363
-
364
-
365
-
366
-
367
-
368
-
369
-
370
-
371
-
372
-
373
-
374
-
375
-
376
-
377
-
378
-
379
-
380
-
381
-
382
-
383
-
384
-
385
-
386
-
387
-
388
-
389
-
390
-
391
-
392
-
393
-
394
-
395
-
396
-
397
-
398
-
399
-
400
-
401
-
402
 |
 |

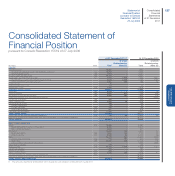
147
Consolidated
Financial Statements
at 31 December 2011
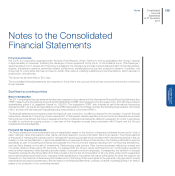
Sales of receivables
The Group sells certain of its financial, trade and tax receivables, mainly through factoring transactions.
Factoring transactions may be with or without recourse to the seller; certain factoring agreements without recourse include deferred
purchase price clauses (i.e. the payment of a minority portion of the purchase price is conditional upon the full collection of the
receivables), require a first loss guarantee of the seller up to a limited amount or imply a continuing significant exposure to the cash
flows of the sold receivables. These kinds of transactions do not meet IAS 39 requirements for assets derecognition, since the risks
and rewards have not been substantially transferred.
Consequently, all receivables sold through factoring transactions which do not meet IAS 39 derecognition requirements are recognised
as such in the Group financial statements even though they have been legally sold; a corresponding financial liability is recorded in the
consolidated statement of financial position as Asset-backed financing. Gains and losses relating to the sale of such assets are not
recognised until the assets are removed from the Group statement of financial position.
Inventories
Inventories of raw materials, semi-finished products and finished goods, (including assets sold with a buy-back commitment) are stated
at the lower of cost and net realisable value, cost being determined on a first in-first-out (FIFO) basis. The measurement of inventories
includes the direct costs of materials, labour and indirect costs (variable and fixed). Provision is made for obsolete and slow-moving
raw materials, finished goods, spare parts and other supplies based on their expected future use and realisable value. Net realisable
value is the estimated selling price in the ordinary course of business less the estimated costs of completion and the estimated costs
for sale and distribution.
The measurement of construction contracts is based on the stage of completion determined as the proportion that cost incurred to
the balance sheet date bears to the estimated total contract cost. These items are presented net of progress billings received from
customers. Any losses on such contracts are fully recorded in the income statement when they become known.
Assets and liabilities held for sale and Discontinued Operations
Non-current assets and disposal groups are classified as held for sale if their carrying amounts will be recovered principally through a
sale transaction rather than through continuing use. This condition is regarded as met only when the sale is highly probable and the
non-current asset (or disposal group) is available for immediate sale in its present condition. When the Group is committed to a sale plan
involving loss of control of a subsidiary, all of the assets and liabilities of that subsidiary are classified as held for sale when the criteria
described above are met, regardless of whether the Group will retain a non-controlling interest in its former subsidiary after the sale.
Non-current assets and disposal groups classified as held for sale are measured at the lower of their carrying amounts and fair value
less costs to sell.
Employee benefits
The present value of a defined benefit obligation and the related current service cost for defined benefit pension plans and other long-
term benefits are determined on an actuarial basis using the projected unit credit method. Under this method, the Group attributes
benefits to periods in which the obligation to provide post-employment benefits arise. That obligation arises when employees render
services.
The present value of the defined benefit obligation is measured by using actuarial techniques and actuarial assumptions that are
unbiased and mutually compatible. Financial assumptions are based on market estimates that are known at the balance sheet date
regarding the period in which the obligations will be settled.
The fair value of plan assets is deducted from the present value of the obligation in determining the amount recognised in the statement
of financial position. This fair value is estimated, where possible, by referring to available market price of the assets, where no market
price is available, the fair value of plan assets is estimated using a valuation technique.