Chrysler 2011 Annual Report Download - page 186
Download and view the complete annual report
Please find page 186 of the 2011 Chrysler annual report below. You can navigate through the pages in the report by either clicking on the pages listed below, or by using the keyword search tool below to find specific information within the annual report.-
 1
1 -
2
-
3
-
4
-
5
-
6
-
7
-
8
-
9
-
10
-
11
-
12
-
13
-
14
-
15
-
16
-
17
-
18
-
19
-
20
-
21
-
22
-
23
-
24
-
25
-
26
-
27
-
28
-
29
-
30
-
31
-
32
-
33
-
34
-
35
-
36
-
37
-
38
-
39
-
40
-
41
-
42
-
43
-
44
-
45
-
46
-
47
-
48
-
49
-
50
-
51
-
52
-
53
-
54
-
55
-
56
-
57
-
58
-
59
-
60
-
61
-
62
-
63
-
64
-
65
-
66
-
67
-
68
-
69
-
70
-
71
-
72
-
73
-
74
-
75
-
76
-
77
-
78
-
79
-
80
-
81
-
82
-
83
-
84
-
85
-
86
-
87
-
88
-
89
-
90
-
91
-
92
-
93
-
94
-
95
-
96
-
97
-
98
-
99
-
100
-
101
-
102
-
103
-
104
-
105
-
106
-
107
-
108
-
109
-
110
-
111
-
112
-
113
-
114
-
115
-
116
-
117
-
118
-
119
-
120
-
121
-
122
-
123
-
124
-
125
-
126
-
127
-
128
-
129
-
130
-
131
-
132
-
133
-
134
-
135
-
136
-
137
-
138
-
139
-
140
-
141
-
142
-
143
-
144
-
145
-
146
-
147
-
148
-
149
-
150
-
151
-
152
-
153
-
154
-
155
-
156
-
157
-
158
-
159
-
160
-
161
-
162
-
163
-
164
-
165
-
166
-
167
-
168
-
169
-
170
-
171
-
172
-
173
-
174
-
175
-
 176
176 -
 177
177 -
 178
178 -
 179
179 -
 180
180 -
 181
181 -
 182
182 -
 183
183 -
 184
184 -
 185
185 -
 186
186 -
 187
187 -
 188
188 -
 189
189 -
 190
190 -
 191
191 -
 192
192 -
 193
193 -
 194
194 -
 195
195 -
 196
196 -
197
-
198
-
199
-
200
-
201
-
202
-
203
-
204
-
205
-
206
-
207
-
208
-
209
-
210
-
211
-
212
-
213
-
214
-
215
-
216
-
217
-
218
-
219
-
220
-
221
-
222
-
223
-
224
-
225
-
226
-
227
-
228
-
229
-
230
-
231
-
232
-
233
-
234
-
235
-
236
-
237
-
238
-
239
-
240
-
241
-
242
-
243
-
244
-
245
-
246
-
247
-
248
-
249
-
250
-
251
-
252
-
253
-
254
-
255
-
256
-
257
-
258
-
259
-
260
-
261
-
262
-
263
-
264
-
265
-
266
-
267
-
268
-
269
-
270
-
271
-
272
-
273
-
274
-
275
-
276
-
277
-
278
-
279
-
280
-
281
-
282
-
283
-
284
-
285
-
286
-
287
-
288
-
289
-
290
-
291
-
292
-
293
-
294
-
295
-
296
-
297
-
298
-
299
-
300
-
301
-
302
-
303
-
304
-
305
-
306
-
307
-
308
-
309
-
310
-
311
-
312
-
313
-
314
-
315
-
316
-
317
-
318
-
319
-
320
-
321
-
322
-
323
-
324
-
325
-
326
-
327
-
328
-
329
-
330
-
331
-
332
-
333
-
334
-
335
-
336
-
337
-
338
-
339
-
340
-
341
-
342
-
343
-
344
-
345
-
346
-
347
-
348
-
349
-
350
-
351
-
352
-
353
-
354
-
355
-
356
-
357
-
358
-
359
-
360
-
361
-
362
-
363
-
364
-
365
-
366
-
367
-
368
-
369
-
370
-
371
-
372
-
373
-
374
-
375
-
376
-
377
-
378
-
379
-
380
-
381
-
382
-
383
-
384
-
385
-
386
-
387
-
388
-
389
-
390
-
391
-
392
-
393
-
394
-
395
-
396
-
397
-
398
-
399
-
400
-
401
-
402
 |
 |

185
Consolidated
Financial Statements
at 31 December 2011
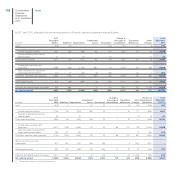
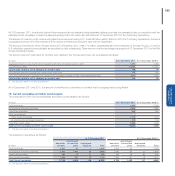
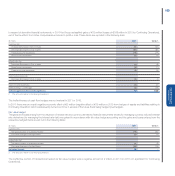
Receivables from financing activities are shown net of an allowance for doubtful accounts determined on the basis of specific insolvency risks. At 31
December 2011, the allowance amounts to €101 million (€102 million at 31 December 2010 for Continuing Operations). Changes in the allowance
accounts during the year are as follows:
(€ million) At 31 December 2010 (*) Provision
Use and
other changes At 31 December 2011
Allowance for receivables regarding:
Retail financing 21 17 (4) 34
Finance leases 9 1 (1) 9
Dealer financing 26 12 (13) 25
Supplier financing 2 - - 2
Other 44 - (13) 31
Total allowance on Receivables from financing activities 102 30 (31) 101
(*) The amounts relate to Continuing Operations.
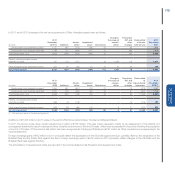
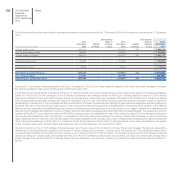
Finance lease receivables refer to vehicles leased out under finance lease arrangements by the Fiat Group Automobiles and Ferrari sectors. The interest rate
implicit in the lease is determined at the contract date for the whole of the lease term and is in line with market rates. This item may be analysed as follows,
gross of an allowance of €9 million at 31 December 2011 (€9 million at 31 December 2010):
At 31 December 2011 At 31 December 2010 (*)
(€ million)
due
within
one year
due between
one and five
years
due
beyond
five years Total
due
within
one year
due between
one and five
years
due
beyond
five years Total
Receivables for future minimum lease payments 110 216 9 335 75 177 6 258
Less: unrealised interest income (5) (11) - (16) (3) (2) (1) (6)
Present value of future minimum lease payments 105 205 9 319 72 175 5 252
(*) The amounts relate to Continuing Operations.
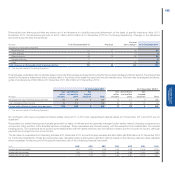
No contingent rents were recognised as finance leases during 2011 or 2010 and unguaranteed residual values at 31 December 2011 and 2010 are not
significant.
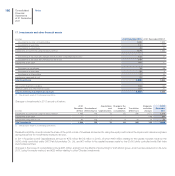
Receivables for dealer financing are typically generated by sales of vehicles and are generally managed under dealer network financing programs as a
component of the portfolio of the financial services companies. These receivables are interest bearing, with the exception of an initial limited, non-interest
bearing period. The contractual terms governing the relationships with the dealer networks vary from sector to sector and from country to country, although
payment terms range from two to six months.
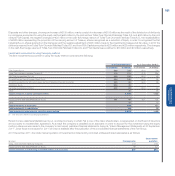
The fair value of receivables from financing activities at 31 December 2011 amounts to approximately €3,956 million (€2,869 million at 31 December 2010
for Continuing Operations). These fair values have been calculated using a discounted cash flow method based on the following discount rates, adjusted
where necessary to take account of the specific insolvency risk of the underlying financial instrument.
(In %) EUR USD GBP CAD AUD BRL PLN
Interest rate for six months 1.62 0.81 1.38 1.45 4.43 10.16 5.00
Interest rate for one year 1.95 1.13 1.87 1.65 3.88 10.04 4.88
Interest rate for five years 1.73 1.23 1.57 1.46 4.31 10.74 4.81