Chrysler 2011 Annual Report Download - page 207
Download and view the complete annual report
Please find page 207 of the 2011 Chrysler annual report below. You can navigate through the pages in the report by either clicking on the pages listed below, or by using the keyword search tool below to find specific information within the annual report.-
 1
1 -
2
-
3
-
4
-
5
-
6
-
7
-
8
-
9
-
10
-
11
-
12
-
13
-
14
-
15
-
16
-
17
-
18
-
19
-
20
-
21
-
22
-
23
-
24
-
25
-
26
-
27
-
28
-
29
-
30
-
31
-
32
-
33
-
34
-
35
-
36
-
37
-
38
-
39
-
40
-
41
-
42
-
43
-
44
-
45
-
46
-
47
-
48
-
49
-
50
-
51
-
52
-
53
-
54
-
55
-
56
-
57
-
58
-
59
-
60
-
61
-
62
-
63
-
64
-
65
-
66
-
67
-
68
-
69
-
70
-
71
-
72
-
73
-
74
-
75
-
76
-
77
-
78
-
79
-
80
-
81
-
82
-
83
-
84
-
85
-
86
-
87
-
88
-
89
-
90
-
91
-
92
-
93
-
94
-
95
-
96
-
97
-
98
-
99
-
100
-
101
-
102
-
103
-
104
-
105
-
106
-
107
-
108
-
109
-
110
-
111
-
112
-
113
-
114
-
115
-
116
-
117
-
118
-
119
-
120
-
121
-
122
-
123
-
124
-
125
-
126
-
127
-
128
-
129
-
130
-
131
-
132
-
133
-
134
-
135
-
136
-
137
-
138
-
139
-
140
-
141
-
142
-
143
-
144
-
145
-
146
-
147
-
148
-
149
-
150
-
151
-
152
-
153
-
154
-
155
-
156
-
157
-
158
-
159
-
160
-
161
-
162
-
163
-
164
-
165
-
166
-
167
-
168
-
169
-
170
-
171
-
172
-
173
-
174
-
175
-
176
-
177
-
178
-
179
-
180
-
181
-
182
-
183
-
184
-
185
-
186
-
187
-
188
-
189
-
190
-
191
-
192
-
193
-
194
-
195
-
196
-
 197
197 -
 198
198 -
 199
199 -
 200
200 -
 201
201 -
 202
202 -
 203
203 -
 204
204 -
 205
205 -
 206
206 -
 207
207 -
 208
208 -
 209
209 -
 210
210 -
 211
211 -
 212
212 -
 213
213 -
 214
214 -
 215
215 -
 216
216 -
 217
217 -
218
-
219
-
220
-
221
-
222
-
223
-
224
-
225
-
226
-
227
-
228
-
229
-
230
-
231
-
232
-
233
-
234
-
235
-
236
-
237
-
238
-
239
-
240
-
241
-
242
-
243
-
244
-
245
-
246
-
247
-
248
-
249
-
250
-
251
-
252
-
253
-
254
-
255
-
256
-
257
-
258
-
259
-
260
-
261
-
262
-
263
-
264
-
265
-
266
-
267
-
268
-
269
-
270
-
271
-
272
-
273
-
274
-
275
-
276
-
277
-
278
-
279
-
280
-
281
-
282
-
283
-
284
-
285
-
286
-
287
-
288
-
289
-
290
-
291
-
292
-
293
-
294
-
295
-
296
-
297
-
298
-
299
-
300
-
301
-
302
-
303
-
304
-
305
-
306
-
307
-
308
-
309
-
310
-
311
-
312
-
313
-
314
-
315
-
316
-
317
-
318
-
319
-
320
-
321
-
322
-
323
-
324
-
325
-
326
-
327
-
328
-
329
-
330
-
331
-
332
-
333
-
334
-
335
-
336
-
337
-
338
-
339
-
340
-
341
-
342
-
343
-
344
-
345
-
346
-
347
-
348
-
349
-
350
-
351
-
352
-
353
-
354
-
355
-
356
-
357
-
358
-
359
-
360
-
361
-
362
-
363
-
364
-
365
-
366
-
367
-
368
-
369
-
370
-
371
-
372
-
373
-
374
-
375
-
376
-
377
-
378
-
379
-
380
-
381
-
382
-
383
-
384
-
385
-
386
-
387
-
388
-
389
-
390
-
391
-
392
-
393
-
394
-
395
-
396
-
397
-
398
-
399
-
400
-
401
-
402
 |
 |

Consolidated
Financial
Statements
at 31 December
2011
Notes
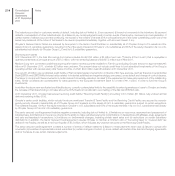
206
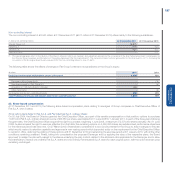
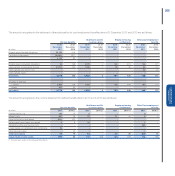
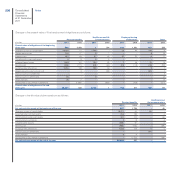
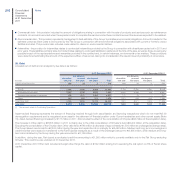
Changes in the present value of Post-employment obligations are as follows:
Pension benefits
Healthcare and life
insurance plans
Employee leaving
entitlements Other
(€ million) 2011 2010 2011 2010 2011 2010 2011 2010
Present value of obligations at the beginning
of the year 522 2,568 1794 811 1,001 127 258
Change in scope of consolidation 20,933 21 1,754 -(3) 44 101 4
Current service cost 120 27 97--815
Interest costs 667 145 57 44 21 32 611
Contribution by plan participants 5354----
Actuarial (gains) losses 1,659 181 134 43 745 (1) 13
Benefits paid (990) (171) (82) (59) (73) (113) (18) (32)
Exchange rate differences 2,255 128 190 64 --21
(Negative)positive past service cost -3-(38) --(69) 7
(Gains) losses on curtailments -------4
(Gains) losses on settlements 36 -2----(2)
Other changes (6) 2-----(1)
Reclassified to Discontinued Operations -(2,385) -(858) -(198) -(151)
Present value of obligations at the end
of the year 25,201 522 2,070 1763 811 156 127
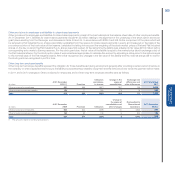
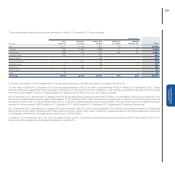
Changes in the fair value of plan assets are as follows:
Pension benefits
Healthcare and
life insurance plans
(€ million) 2011 2010 2011 2010
Fair value of plan assets at the beginning of the year 327 1,796 -46
Change in scope of consolidation 18,317 20 26 -
Expected return on plan assets 816 135 -4
Contributions by plan participants 221 102 -55
Contributions by employer 53-4
Actuarial gains (losses) (530) 37 -2
Benefits paid (985) (158) -(59)
Exchange rate differences 1,830 108 14
(Gains) losses on settlements --(27) -
Other changes 34--
Reclassified to Discontinued Operations -(1,720) -(56)
Fair value of plan assets at the end of the year 20,004 327 --