Chrysler 2011 Annual Report Download - page 44
Download and view the complete annual report
Please find page 44 of the 2011 Chrysler annual report below. You can navigate through the pages in the report by either clicking on the pages listed below, or by using the keyword search tool below to find specific information within the annual report.-
 1
1 -
2
-
3
-
4
-
5
-
6
-
7
-
8
-
9
-
10
-
11
-
12
-
13
-
14
-
15
-
16
-
17
-
18
-
19
-
20
-
21
-
22
-
23
-
24
-
25
-
26
-
27
-
28
-
29
-
30
-
31
-
32
-
33
-
 34
34 -
 35
35 -
 36
36 -
 37
37 -
 38
38 -
 39
39 -
 40
40 -
 41
41 -
 42
42 -
 43
43 -
 44
44 -
 45
45 -
 46
46 -
 47
47 -
 48
48 -
 49
49 -
 50
50 -
 51
51 -
 52
52 -
 53
53 -
 54
54 -
55
-
56
-
57
-
58
-
59
-
60
-
61
-
62
-
63
-
64
-
65
-
66
-
67
-
68
-
69
-
70
-
71
-
72
-
73
-
74
-
75
-
76
-
77
-
78
-
79
-
80
-
81
-
82
-
83
-
84
-
85
-
86
-
87
-
88
-
89
-
90
-
91
-
92
-
93
-
94
-
95
-
96
-
97
-
98
-
99
-
100
-
101
-
102
-
103
-
104
-
105
-
106
-
107
-
108
-
109
-
110
-
111
-
112
-
113
-
114
-
115
-
116
-
117
-
118
-
119
-
120
-
121
-
122
-
123
-
124
-
125
-
126
-
127
-
128
-
129
-
130
-
131
-
132
-
133
-
134
-
135
-
136
-
137
-
138
-
139
-
140
-
141
-
142
-
143
-
144
-
145
-
146
-
147
-
148
-
149
-
150
-
151
-
152
-
153
-
154
-
155
-
156
-
157
-
158
-
159
-
160
-
161
-
162
-
163
-
164
-
165
-
166
-
167
-
168
-
169
-
170
-
171
-
172
-
173
-
174
-
175
-
176
-
177
-
178
-
179
-
180
-
181
-
182
-
183
-
184
-
185
-
186
-
187
-
188
-
189
-
190
-
191
-
192
-
193
-
194
-
195
-
196
-
197
-
198
-
199
-
200
-
201
-
202
-
203
-
204
-
205
-
206
-
207
-
208
-
209
-
210
-
211
-
212
-
213
-
214
-
215
-
216
-
217
-
218
-
219
-
220
-
221
-
222
-
223
-
224
-
225
-
226
-
227
-
228
-
229
-
230
-
231
-
232
-
233
-
234
-
235
-
236
-
237
-
238
-
239
-
240
-
241
-
242
-
243
-
244
-
245
-
246
-
247
-
248
-
249
-
250
-
251
-
252
-
253
-
254
-
255
-
256
-
257
-
258
-
259
-
260
-
261
-
262
-
263
-
264
-
265
-
266
-
267
-
268
-
269
-
270
-
271
-
272
-
273
-
274
-
275
-
276
-
277
-
278
-
279
-
280
-
281
-
282
-
283
-
284
-
285
-
286
-
287
-
288
-
289
-
290
-
291
-
292
-
293
-
294
-
295
-
296
-
297
-
298
-
299
-
300
-
301
-
302
-
303
-
304
-
305
-
306
-
307
-
308
-
309
-
310
-
311
-
312
-
313
-
314
-
315
-
316
-
317
-
318
-
319
-
320
-
321
-
322
-
323
-
324
-
325
-
326
-
327
-
328
-
329
-
330
-
331
-
332
-
333
-
334
-
335
-
336
-
337
-
338
-
339
-
340
-
341
-
342
-
343
-
344
-
345
-
346
-
347
-
348
-
349
-
350
-
351
-
352
-
353
-
354
-
355
-
356
-
357
-
358
-
359
-
360
-
361
-
362
-
363
-
364
-
365
-
366
-
367
-
368
-
369
-
370
-
371
-
372
-
373
-
374
-
375
-
376
-
377
-
378
-
379
-
380
-
381
-
382
-
383
-
384
-
385
-
386
-
387
-
388
-
389
-
390
-
391
-
392
-
393
-
394
-
395
-
396
-
397
-
398
-
399
-
400
-
401
-
402
 |
 |
43
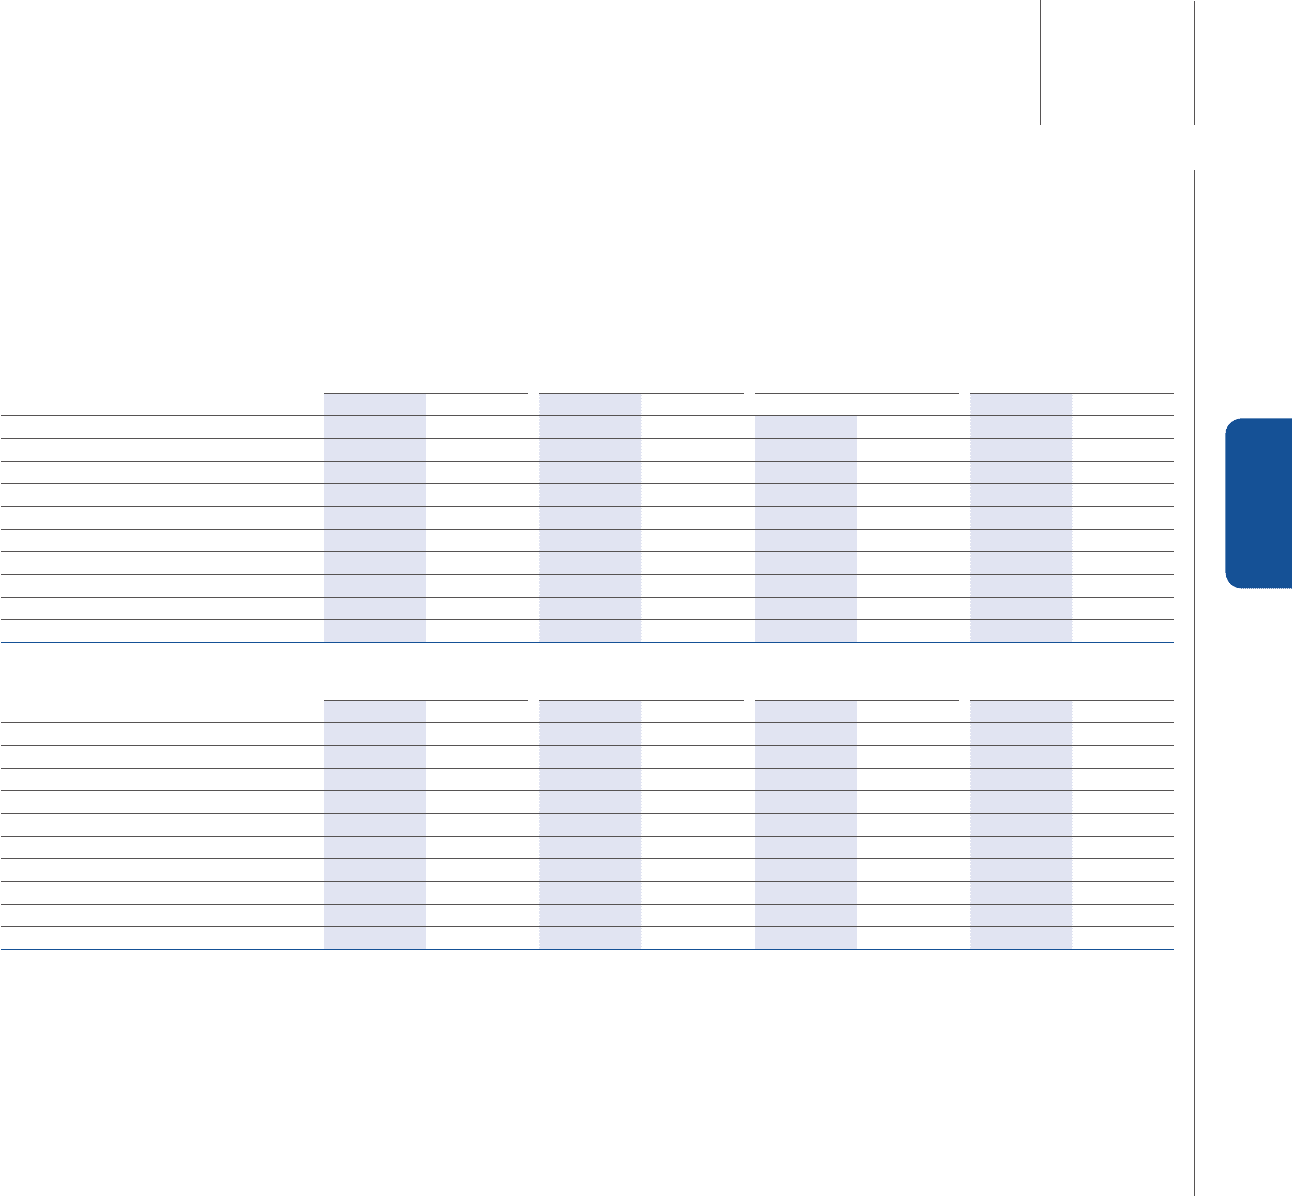
Report on Operations
Highlights by Sector
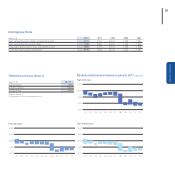
Net revenues Trading profit/(loss) Operating profit/(loss) Total operating assets
(€ million) 2011 2010 2011 2010 2011 2010 2011 2010
Fiat Group Automobiles 27,980 27,860 430 607 1,876 515 22,190 17,027
Chrysler (1) 23,609 -1,345 -1,200 -31,251 -
Maserati 588 586 40 24 40 24 477 382
Ferrari 2,251 1,919 312 303 318 302 1,911 1,667
Components (Magneti Marelli) 5,860 5,402 181 98 27 73 3,365 3,395
Fiat Powertrain 4,450 4,211 131 140 134 172 3,258 3,419
Metallurgical Products (Teksid) 922 776 26 17 (2) 17 546 581
Production Systems (Comau) 1,402 1,023 10 (6) (120) (6) 742 697
Other Businesses and Eliminations (7,503) (5,897) (83) (71) (137) (105) (4,818) (399)
TOTAL FIAT GROUP 59,559 35,880 2,392 1,112 3,336 992 58,922 26,769
Total operating liabilities Capital expenditure(2) R&D expense(3) Number of employees
(€ million) 2011 2010 2011 2010 2011 2010 2011 2010
Fiat Group Automobiles 16,587 14,796 2,367 1,652 771 722 59,714 57,611
Chrysler (1) 20,686 -1,936 -764 -55,687 -
Maserati 391 350 134 104 113 62 714 696
Ferrari 1,524 1,141 231 239 143 148 2,695 2,721
Components (Magneti Marelli) 2,110 2,045 487 383 309 292 34,804 34,269
Fiat Powertrain 1,795 1,826 269 385 87 80 12,552 12,453
Metallurgical Products (Teksid) 325 293 38 31 127,865 7,275
Production Systems (Comau) 648 513 20 24 14 12 14,457 12,216
Other Businesses and Eliminations (1,224) 2,287 46 46 (27) (34) 8,533 10,560
TOTAL FIAT GROUP 42,842 23,251 5,528 2,864 2,175 1,284 197,021 137,801
(1) Consolidated from 1 June 2011
(2) Investments in tangible and intangible assets (net of vehicles sold under buy-back commitments and leased out)
(3) Includes capitalized R&D and R&D charged directly to the income statement
Report on
Operations
Highlights
by Sector