Chrysler 2011 Annual Report Download - page 75
Download and view the complete annual report
Please find page 75 of the 2011 Chrysler annual report below. You can navigate through the pages in the report by either clicking on the pages listed below, or by using the keyword search tool below to find specific information within the annual report.-
 1
1 -
2
-
3
-
4
-
5
-
6
-
7
-
8
-
9
-
10
-
11
-
12
-
13
-
14
-
15
-
16
-
17
-
18
-
19
-
20
-
21
-
22
-
23
-
24
-
25
-
26
-
27
-
28
-
29
-
30
-
31
-
32
-
33
-
34
-
35
-
36
-
37
-
38
-
39
-
40
-
41
-
42
-
43
-
44
-
45
-
46
-
47
-
48
-
49
-
50
-
51
-
52
-
53
-
54
-
55
-
56
-
57
-
58
-
59
-
60
-
61
-
62
-
63
-
64
-
 65
65 -
 66
66 -
 67
67 -
 68
68 -
 69
69 -
 70
70 -
 71
71 -
 72
72 -
 73
73 -
 74
74 -
 75
75 -
 76
76 -
 77
77 -
 78
78 -
 79
79 -
 80
80 -
 81
81 -
 82
82 -
 83
83 -
 84
84 -
 85
85 -
86
-
87
-
88
-
89
-
90
-
91
-
92
-
93
-
94
-
95
-
96
-
97
-
98
-
99
-
100
-
101
-
102
-
103
-
104
-
105
-
106
-
107
-
108
-
109
-
110
-
111
-
112
-
113
-
114
-
115
-
116
-
117
-
118
-
119
-
120
-
121
-
122
-
123
-
124
-
125
-
126
-
127
-
128
-
129
-
130
-
131
-
132
-
133
-
134
-
135
-
136
-
137
-
138
-
139
-
140
-
141
-
142
-
143
-
144
-
145
-
146
-
147
-
148
-
149
-
150
-
151
-
152
-
153
-
154
-
155
-
156
-
157
-
158
-
159
-
160
-
161
-
162
-
163
-
164
-
165
-
166
-
167
-
168
-
169
-
170
-
171
-
172
-
173
-
174
-
175
-
176
-
177
-
178
-
179
-
180
-
181
-
182
-
183
-
184
-
185
-
186
-
187
-
188
-
189
-
190
-
191
-
192
-
193
-
194
-
195
-
196
-
197
-
198
-
199
-
200
-
201
-
202
-
203
-
204
-
205
-
206
-
207
-
208
-
209
-
210
-
211
-
212
-
213
-
214
-
215
-
216
-
217
-
218
-
219
-
220
-
221
-
222
-
223
-
224
-
225
-
226
-
227
-
228
-
229
-
230
-
231
-
232
-
233
-
234
-
235
-
236
-
237
-
238
-
239
-
240
-
241
-
242
-
243
-
244
-
245
-
246
-
247
-
248
-
249
-
250
-
251
-
252
-
253
-
254
-
255
-
256
-
257
-
258
-
259
-
260
-
261
-
262
-
263
-
264
-
265
-
266
-
267
-
268
-
269
-
270
-
271
-
272
-
273
-
274
-
275
-
276
-
277
-
278
-
279
-
280
-
281
-
282
-
283
-
284
-
285
-
286
-
287
-
288
-
289
-
290
-
291
-
292
-
293
-
294
-
295
-
296
-
297
-
298
-
299
-
300
-
301
-
302
-
303
-
304
-
305
-
306
-
307
-
308
-
309
-
310
-
311
-
312
-
313
-
314
-
315
-
316
-
317
-
318
-
319
-
320
-
321
-
322
-
323
-
324
-
325
-
326
-
327
-
328
-
329
-
330
-
331
-
332
-
333
-
334
-
335
-
336
-
337
-
338
-
339
-
340
-
341
-
342
-
343
-
344
-
345
-
346
-
347
-
348
-
349
-
350
-
351
-
352
-
353
-
354
-
355
-
356
-
357
-
358
-
359
-
360
-
361
-
362
-
363
-
364
-
365
-
366
-
367
-
368
-
369
-
370
-
371
-
372
-
373
-
374
-
375
-
376
-
377
-
378
-
379
-
380
-
381
-
382
-
383
-
384
-
385
-
386
-
387
-
388
-
389
-
390
-
391
-
392
-
393
-
394
-
395
-
396
-
397
-
398
-
399
-
400
-
401
-
402
 |
 |

Report on
Operations
74
Financial
Review –
Fiat Group
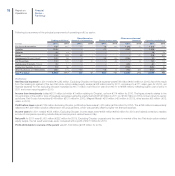
In Europe, the passenger car market was down 1.4% overall to approximately 13.6 million vehicles for the year, with performance uneven across markets.
Demand in Germany was up 8.8% for the year, while in Italy it was down a further 10.9%, following a 9.2% decline in 2010, to 1.75 million units (the lowest
level since 1996). Declines were also recorded in Spain (-17.7%) and the UK (-4.4%). In France, the market was down 2.1% for the year and contracted
8.6% in the fourth quarter. For other markets, demand was up in the Netherlands, Switzerland, Austria and Belgium, but down sharply in both Greece
and Portugal.
For passenger cars only, FGA shipped 1,612,900 vehicles, a 4.6% decrease over 2010. In Europe, shipments were down 10.7% to 860,000 units due to
an unfavorable market and segment mix. The significant volume increase in Germany (+7.2%) only partially offset reductions in the other major markets
(Italy -12.4%, France -15.8%, the UK -1.9% and Spain -21.6%), although gains were achieved in several of FGA’s smaller markets.
In terms of market share in Europe, FGA recorded a 6.9% share for the year, a 0.8 percentage point decrease primarily attributable to the reduced weight
of the Italian market and a shift in demand towards larger vehicle segments. The contraction in demand in the A and B segments in particular (-15% and
-9%, respectively, compared to a 1.4% decline for the market overall) accounted for a 0.6 p.p. decrease in share. In addition, 2011 saw a 73% reduction
in demand for CNG and LPG vehicles in Italy, where FGA is market leader, following on from an already significant decline in 2010.
In Italy, FGA’s share was 29.4%, down 0.9 p.p. for the year – primarily as a result of a 2.3 p.p. loss in Q1 2011 compared to Q1 2010, which benefited from
the tail of eco-incentives – notwithstanding significant share increases in its three main market segments. There were modest declines in the other major
European markets, with Germany down 0.1 p.p. to 3.1%, France -0.4 p.p. to 3.6%, the UK -0.2 p.p. to 3.0% and Spain -0.2 p.p. to 3.1%. Elsewhere in
Europe, notable performance was achieved in the Netherlands, which, with approximately 37,000 vehicles sold and a share of 6.7%, has become FGA’s
fifth largest market in Europe.
For LCVs, demand in Europe was 7.6% higher for the year at nearly 1,800,000 units. In the major markets, demand was uneven with double-digit growth
in Germany (+15.3%) and the UK (+15.3%), a more modest increase in France (+3.4%), but declines in both Italy (-4.7%) and Spain (-10.3%). Throughout
the rest of Europe, demand was 12.6% higher for the year.
FGA shipped a total of 420,000 LCVs, representing a 7.6% increase over 2010. For Europe, 223,700 vehicles were shipped, representing a 10.5%
increase over 2010. In terms of market share, Fiat Professional achieved a 0.4 p.p. gain in Italy to 44.4%. For Europe, share of the LCV market remained
essentially stable at 12.5%3 (excluding Italy, share was up 0.2 p.p. to 9.0%). The primary contribution came from the Ducato, which recorded a 13.5%
increase in sales over the prior year to 110,000 vehicles and the best ever share in its segment.
In Brazil, demand for passenger cars and LCVs rose 2.9% to over 3.4 million units. The passenger car market was in line with the prior year, while demand
for LCVs was up 13.0%.
FGA shipped a total of 772,700 passenger cars and LCVs, representing a 1.5% increase over 2010 and an all-time annual record. Including Chrysler
Group brands, overall share in Brazil was 22.2% (+1.8 p.p. over the nearest competitor). Fiat brand retained its leadership for the 10th consecutive year,
while maintaining pricing discipline in an increasingly competitive market.
In Argentina, where overall demand was approximately 29% higher, FGA increased sales by around 34% to 88,000 units, with share up 0.4 p.p. to 10.8%.
Chrysler posted revenues for the 7 months from June-December of €23,609 million (USD 32.9 billion) on worldwide shipments of 1,190,000 vehicles, of
which the U.S. and Canada accounted for 82%. For the full year, worldwide vehicle shipments totaled 2,011,000 (up 26% over 2010) with 72% shipped
in the U.S., 12% in Canada and 16% in other regions. Vehicle sales4 were up 26% for the full year in the U.S. and 13% in Canada. Share increased 1.3
p.p. over the prior year in both markets, coming in at 10.5% and 14.3%, respectively.
Maserati closed 2011 with total shipments up 8.5% to 6,159 vehicles, generating revenues of €588 million. The U.S. remained Maserati’s no. 1 market,
with shipments up 20% over the prior year to 2,437 vehicles. With a total of 842 shipments for the year, China became the brand’s second largest market
worldwide.
Ferrari reported 2011 revenues of €2,251 million, up 17.3% over 2010 on the strength of higher volumes and the contribution from the personalization
program. A total of 7,195 vehicles were shipped during the year, representing a 9.5% increase over 2010 and an all-time record for the brand.
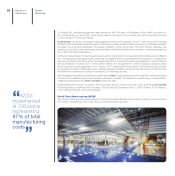
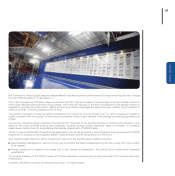
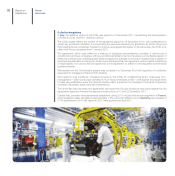
Components & Production Systems
The Components & Production Systems businesses reported revenues of €11,965 million, a 10.1% increase driven primarily by the volume growth
registered for all sectors.
(3) Due to the unavailability of data since January 2011, figures for Italy are an extrapolation and, therefore, the EU total is subject to a margin of error
(4) “Sales” represents sales to end customers as reported by Chrysler dealer network