Chrysler 2011 Annual Report Download - page 169
Download and view the complete annual report
Please find page 169 of the 2011 Chrysler annual report below. You can navigate through the pages in the report by either clicking on the pages listed below, or by using the keyword search tool below to find specific information within the annual report.-
 1
1 -
2
-
3
-
4
-
5
-
6
-
7
-
8
-
9
-
10
-
11
-
12
-
13
-
14
-
15
-
16
-
17
-
18
-
19
-
20
-
21
-
22
-
23
-
24
-
25
-
26
-
27
-
28
-
29
-
30
-
31
-
32
-
33
-
34
-
35
-
36
-
37
-
38
-
39
-
40
-
41
-
42
-
43
-
44
-
45
-
46
-
47
-
48
-
49
-
50
-
51
-
52
-
53
-
54
-
55
-
56
-
57
-
58
-
59
-
60
-
61
-
62
-
63
-
64
-
65
-
66
-
67
-
68
-
69
-
70
-
71
-
72
-
73
-
74
-
75
-
76
-
77
-
78
-
79
-
80
-
81
-
82
-
83
-
84
-
85
-
86
-
87
-
88
-
89
-
90
-
91
-
92
-
93
-
94
-
95
-
96
-
97
-
98
-
99
-
100
-
101
-
102
-
103
-
104
-
105
-
106
-
107
-
108
-
109
-
110
-
111
-
112
-
113
-
114
-
115
-
116
-
117
-
118
-
119
-
120
-
121
-
122
-
123
-
124
-
125
-
126
-
127
-
128
-
129
-
130
-
131
-
132
-
133
-
134
-
135
-
136
-
137
-
138
-
139
-
140
-
141
-
142
-
143
-
144
-
145
-
146
-
147
-
148
-
149
-
150
-
151
-
152
-
153
-
154
-
155
-
156
-
157
-
158
-
 159
159 -
 160
160 -
 161
161 -
 162
162 -
 163
163 -
 164
164 -
 165
165 -
 166
166 -
 167
167 -
 168
168 -
 169
169 -
 170
170 -
 171
171 -
 172
172 -
 173
173 -
 174
174 -
 175
175 -
 176
176 -
 177
177 -
 178
178 -
 179
179 -
180
-
181
-
182
-
183
-
184
-
185
-
186
-
187
-
188
-
189
-
190
-
191
-
192
-
193
-
194
-
195
-
196
-
197
-
198
-
199
-
200
-
201
-
202
-
203
-
204
-
205
-
206
-
207
-
208
-
209
-
210
-
211
-
212
-
213
-
214
-
215
-
216
-
217
-
218
-
219
-
220
-
221
-
222
-
223
-
224
-
225
-
226
-
227
-
228
-
229
-
230
-
231
-
232
-
233
-
234
-
235
-
236
-
237
-
238
-
239
-
240
-
241
-
242
-
243
-
244
-
245
-
246
-
247
-
248
-
249
-
250
-
251
-
252
-
253
-
254
-
255
-
256
-
257
-
258
-
259
-
260
-
261
-
262
-
263
-
264
-
265
-
266
-
267
-
268
-
269
-
270
-
271
-
272
-
273
-
274
-
275
-
276
-
277
-
278
-
279
-
280
-
281
-
282
-
283
-
284
-
285
-
286
-
287
-
288
-
289
-
290
-
291
-
292
-
293
-
294
-
295
-
296
-
297
-
298
-
299
-
300
-
301
-
302
-
303
-
304
-
305
-
306
-
307
-
308
-
309
-
310
-
311
-
312
-
313
-
314
-
315
-
316
-
317
-
318
-
319
-
320
-
321
-
322
-
323
-
324
-
325
-
326
-
327
-
328
-
329
-
330
-
331
-
332
-
333
-
334
-
335
-
336
-
337
-
338
-
339
-
340
-
341
-
342
-
343
-
344
-
345
-
346
-
347
-
348
-
349
-
350
-
351
-
352
-
353
-
354
-
355
-
356
-
357
-
358
-
359
-
360
-
361
-
362
-
363
-
364
-
365
-
366
-
367
-
368
-
369
-
370
-
371
-
372
-
373
-
374
-
375
-
376
-
377
-
378
-
379
-
380
-
381
-
382
-
383
-
384
-
385
-
386
-
387
-
388
-
389
-
390
-
391
-
392
-
393
-
394
-
395
-
396
-
397
-
398
-
399
-
400
-
401
-
402
 |
 |
Consolidated
Financial
Statements
at 31 December
2011
Notes
168
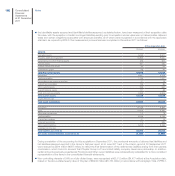
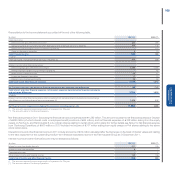
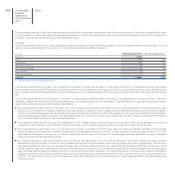
The decrease of €613 million in net deferred tax assets is mainly due to the following:
the change in the scope of consolidation arising from the acquisition of control of Chrysler and the subsequent acquisition of further membership interests
in Chrysler, which led to the recognition of net deferred tax liabilities of €562 million;
the recognition of deferred tax assets on the temporary differences and tax losses arising during the year less the effects arising from the recognition/
write-off of deferred tax assets relating to prior years, amounting to €25 million;
the direct recognition in equity of net deferred tax assets of €15 million.
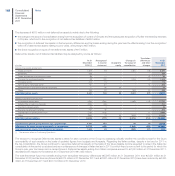
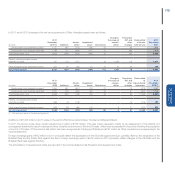
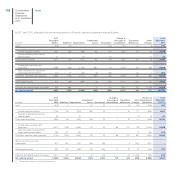
Deferred tax assets, net of Deferred tax liabilities may be analysed by source as follows:
(€ million)
At 31
December
2010 (*)
Recognised
in income
statement
Charged to
equity
Changes in
the scope of
consolidation
Translation
differences
and other
changes
At 31
December
2011
Deferred tax assets arising from:
Taxed provisions 1,509 93 - 1,367 128 3,097
Inventories 229 - - - - 229
Taxed allowances for doubtful accounts 88 (1) - - (2) 85
Provision for employee benefits 33 (22) - 1,234 129 1,374
Intangible assets 404 15 - - - 419
Write-downs of financial assets 157 57 - - (2) 212
Measurement of derivative financial instruments 17 (4) 20 - - 33
Other 194 22 - 300 22 538
Total Deferred tax assets 2,631 160 20 2,901 275 5,987
Deferred tax liabilities arising from:
Accelerated depreciation (266) (284) - (1,068) (115) (1,733)
Deferred tax on gains on disposal (150) 136 - - - (14)
Capital investment grants (4) 1 - - - (3)
Provision for employee benefits (16) (3) - - - (19)
Capitalisation of development costs (708) (103) - - 11 (800)
Other (355) 76 (5) (946) (110) (1,340)
Total Deferred tax liabilities (1,499) (177) (5) (2,014) (214) (3,909)
Theoretical tax benefit arising from tax loss carryforwards 2,581 510 - 94 30 3,215
Adjustments for assets whose recoverability is not probable (2,170) (468) - (1,543) (182) (4,363)
Total Deferred tax assets, net of Deferred tax liabilities 1,543 25 15 (562) (91) 930
(*) The amounts relate to Continuing Operations.
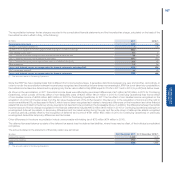
The decision to recognise Deferred tax assets is taken for each company in the Group by assessing critically whether the conditions exist for the future
recoverability of such assets on the basis of updated figures from budgets and forecasts. Regarding the Italian entities, despite a tax loss for 2011 in
the tax consolidation, the Group continued to recognise deferred tax assets on the basis of the future taxable income expected to arise in the Italian tax
consolidation in the period considered and as a consequence of changes in Italian tax law in 2011 by which there is now no limit to the period for which the
Group’s prior year tax losses can be carried forward. Deferred tax assets arising from Italian companies amount to €1,033 million at 31 December 2011,
decreased with respect to the balance at 31 December 2010 (€1,083 million).
The total theoretical future tax benefits arising from deductible temporary differences (€5,987 million at 31 December 2011 and €2,631 million at 31
December 2010) and tax loss carryforwards (€3,215 million at 31 December 2011 and €2,581 million at 31 December 2010) have been reduced by €4,363
million at 31 December 2011 and €2,170 million at 31 December 2010.