Chrysler 2011 Annual Report Download - page 205
Download and view the complete annual report
Please find page 205 of the 2011 Chrysler annual report below. You can navigate through the pages in the report by either clicking on the pages listed below, or by using the keyword search tool below to find specific information within the annual report.-
 1
1 -
2
-
3
-
4
-
5
-
6
-
7
-
8
-
9
-
10
-
11
-
12
-
13
-
14
-
15
-
16
-
17
-
18
-
19
-
20
-
21
-
22
-
23
-
24
-
25
-
26
-
27
-
28
-
29
-
30
-
31
-
32
-
33
-
34
-
35
-
36
-
37
-
38
-
39
-
40
-
41
-
42
-
43
-
44
-
45
-
46
-
47
-
48
-
49
-
50
-
51
-
52
-
53
-
54
-
55
-
56
-
57
-
58
-
59
-
60
-
61
-
62
-
63
-
64
-
65
-
66
-
67
-
68
-
69
-
70
-
71
-
72
-
73
-
74
-
75
-
76
-
77
-
78
-
79
-
80
-
81
-
82
-
83
-
84
-
85
-
86
-
87
-
88
-
89
-
90
-
91
-
92
-
93
-
94
-
95
-
96
-
97
-
98
-
99
-
100
-
101
-
102
-
103
-
104
-
105
-
106
-
107
-
108
-
109
-
110
-
111
-
112
-
113
-
114
-
115
-
116
-
117
-
118
-
119
-
120
-
121
-
122
-
123
-
124
-
125
-
126
-
127
-
128
-
129
-
130
-
131
-
132
-
133
-
134
-
135
-
136
-
137
-
138
-
139
-
140
-
141
-
142
-
143
-
144
-
145
-
146
-
147
-
148
-
149
-
150
-
151
-
152
-
153
-
154
-
155
-
156
-
157
-
158
-
159
-
160
-
161
-
162
-
163
-
164
-
165
-
166
-
167
-
168
-
169
-
170
-
171
-
172
-
173
-
174
-
175
-
176
-
177
-
178
-
179
-
180
-
181
-
182
-
183
-
184
-
185
-
186
-
187
-
188
-
189
-
190
-
191
-
192
-
193
-
194
-
 195
195 -
 196
196 -
 197
197 -
 198
198 -
 199
199 -
 200
200 -
 201
201 -
 202
202 -
 203
203 -
 204
204 -
 205
205 -
 206
206 -
 207
207 -
 208
208 -
 209
209 -
 210
210 -
 211
211 -
 212
212 -
 213
213 -
 214
214 -
 215
215 -
216
-
217
-
218
-
219
-
220
-
221
-
222
-
223
-
224
-
225
-
226
-
227
-
228
-
229
-
230
-
231
-
232
-
233
-
234
-
235
-
236
-
237
-
238
-
239
-
240
-
241
-
242
-
243
-
244
-
245
-
246
-
247
-
248
-
249
-
250
-
251
-
252
-
253
-
254
-
255
-
256
-
257
-
258
-
259
-
260
-
261
-
262
-
263
-
264
-
265
-
266
-
267
-
268
-
269
-
270
-
271
-
272
-
273
-
274
-
275
-
276
-
277
-
278
-
279
-
280
-
281
-
282
-
283
-
284
-
285
-
286
-
287
-
288
-
289
-
290
-
291
-
292
-
293
-
294
-
295
-
296
-
297
-
298
-
299
-
300
-
301
-
302
-
303
-
304
-
305
-
306
-
307
-
308
-
309
-
310
-
311
-
312
-
313
-
314
-
315
-
316
-
317
-
318
-
319
-
320
-
321
-
322
-
323
-
324
-
325
-
326
-
327
-
328
-
329
-
330
-
331
-
332
-
333
-
334
-
335
-
336
-
337
-
338
-
339
-
340
-
341
-
342
-
343
-
344
-
345
-
346
-
347
-
348
-
349
-
350
-
351
-
352
-
353
-
354
-
355
-
356
-
357
-
358
-
359
-
360
-
361
-
362
-
363
-
364
-
365
-
366
-
367
-
368
-
369
-
370
-
371
-
372
-
373
-
374
-
375
-
376
-
377
-
378
-
379
-
380
-
381
-
382
-
383
-
384
-
385
-
386
-
387
-
388
-
389
-
390
-
391
-
392
-
393
-
394
-
395
-
396
-
397
-
398
-
399
-
400
-
401
-
402
 |
 |

Consolidated
Financial
Statements
at 31 December
2011
Notes
204
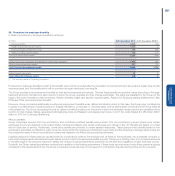
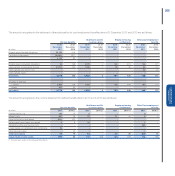
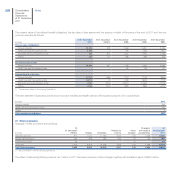
The main assumptions used to determine the net liability for the pension benefits were as follows:
At 31 December 2011 At 31 December 2010
(In %) USA
Canada &
Mexico UK USA
Canada &
Mexico UK
Discount rate 5.0 4.1 5.1 5.2 n/a 5.2
Future salary increase rate 3.8 3.5 2.7 n/a n/a 3.5
Inflation rate n/a n/a 2.7 n/a n/a 3.5
Expected long term rate of return on plan assets 7.5 7.0 7.0 8.0 n/a 7.0
The main assumptions used to determine the net liability for other post-employment benefits were as follows:
At 31 December 2011 At 31 December 2010
(In %) USA
Canada &
Mexico Italy USA
Canada &
Mexico Italy
Discount rate 5.1 4.2 4.4 5.2 n/a 4.2
Future salary increase rate n/a 2.7 3.2 n/a n/a 3.3
Inflation rate n/a n/a 2.0 n/a n/a 2.0
Weighted average ultimate healthcare cost trend rate 5.0 3.7 n/a 8.0 n/a n/a
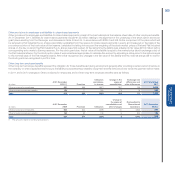
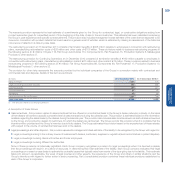
The discount rates are used in measuring the obligation and the interest component of net period cost. The Group selects these rates on the basis of the
yields on high-quality fixed income investments for which the timing and amounts of payments match the timing and amounts of the projected pension and
other post-employment plan.
The expected long-term rates of return on plan assets reflect the Group’s expectations on long-term rates of return on invested funds. The expected rates
are based on estimates made by various consultants for long-term returns on the capital markets and on the outlook for inflation and bond yields, and also
by taking into account asset make-up and the Group’s investment strategy.
The annual rate of increase in the cost of health care benefits in the United States was assumed to be 8.5% in 2011. The annual rate was assumed to
decrease gradually to 5.0% after 2017 and remain at that level thereafter. The annual rate of increase in the cost of health care benefits in Canada was
assumed to be 3.7% in 2011. The annual rate was assumed to remain at 3.7% thereafter.
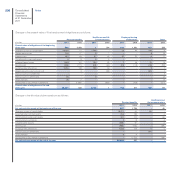
Assumed health care cost trend rates have a significant effect on the amount recognised in profit or loss. A one percentage point change in assumed health
care cost trend rates would have the following effects:
(€ million)
One percentage
point increase
One percentage
point decrease
Effect on the aggregate of the service costs and interest cost 2 (2)
Effect on defined benefit obligation 52 (44)