Chrysler 2011 Annual Report Download - page 176
Download and view the complete annual report
Please find page 176 of the 2011 Chrysler annual report below. You can navigate through the pages in the report by either clicking on the pages listed below, or by using the keyword search tool below to find specific information within the annual report.-
 1
1 -
2
-
3
-
4
-
5
-
6
-
7
-
8
-
9
-
10
-
11
-
12
-
13
-
14
-
15
-
16
-
17
-
18
-
19
-
20
-
21
-
22
-
23
-
24
-
25
-
26
-
27
-
28
-
29
-
30
-
31
-
32
-
33
-
34
-
35
-
36
-
37
-
38
-
39
-
40
-
41
-
42
-
43
-
44
-
45
-
46
-
47
-
48
-
49
-
50
-
51
-
52
-
53
-
54
-
55
-
56
-
57
-
58
-
59
-
60
-
61
-
62
-
63
-
64
-
65
-
66
-
67
-
68
-
69
-
70
-
71
-
72
-
73
-
74
-
75
-
76
-
77
-
78
-
79
-
80
-
81
-
82
-
83
-
84
-
85
-
86
-
87
-
88
-
89
-
90
-
91
-
92
-
93
-
94
-
95
-
96
-
97
-
98
-
99
-
100
-
101
-
102
-
103
-
104
-
105
-
106
-
107
-
108
-
109
-
110
-
111
-
112
-
113
-
114
-
115
-
116
-
117
-
118
-
119
-
120
-
121
-
122
-
123
-
124
-
125
-
126
-
127
-
128
-
129
-
130
-
131
-
132
-
133
-
134
-
135
-
136
-
137
-
138
-
139
-
140
-
141
-
142
-
143
-
144
-
145
-
146
-
147
-
148
-
149
-
150
-
151
-
152
-
153
-
154
-
155
-
156
-
157
-
158
-
159
-
160
-
161
-
162
-
163
-
164
-
165
-
 166
166 -
 167
167 -
 168
168 -
 169
169 -
 170
170 -
 171
171 -
 172
172 -
 173
173 -
 174
174 -
 175
175 -
 176
176 -
 177
177 -
 178
178 -
 179
179 -
 180
180 -
 181
181 -
 182
182 -
 183
183 -
 184
184 -
 185
185 -
 186
186 -
187
-
188
-
189
-
190
-
191
-
192
-
193
-
194
-
195
-
196
-
197
-
198
-
199
-
200
-
201
-
202
-
203
-
204
-
205
-
206
-
207
-
208
-
209
-
210
-
211
-
212
-
213
-
214
-
215
-
216
-
217
-
218
-
219
-
220
-
221
-
222
-
223
-
224
-
225
-
226
-
227
-
228
-
229
-
230
-
231
-
232
-
233
-
234
-
235
-
236
-
237
-
238
-
239
-
240
-
241
-
242
-
243
-
244
-
245
-
246
-
247
-
248
-
249
-
250
-
251
-
252
-
253
-
254
-
255
-
256
-
257
-
258
-
259
-
260
-
261
-
262
-
263
-
264
-
265
-
266
-
267
-
268
-
269
-
270
-
271
-
272
-
273
-
274
-
275
-
276
-
277
-
278
-
279
-
280
-
281
-
282
-
283
-
284
-
285
-
286
-
287
-
288
-
289
-
290
-
291
-
292
-
293
-
294
-
295
-
296
-
297
-
298
-
299
-
300
-
301
-
302
-
303
-
304
-
305
-
306
-
307
-
308
-
309
-
310
-
311
-
312
-
313
-
314
-
315
-
316
-
317
-
318
-
319
-
320
-
321
-
322
-
323
-
324
-
325
-
326
-
327
-
328
-
329
-
330
-
331
-
332
-
333
-
334
-
335
-
336
-
337
-
338
-
339
-
340
-
341
-
342
-
343
-
344
-
345
-
346
-
347
-
348
-
349
-
350
-
351
-
352
-
353
-
354
-
355
-
356
-
357
-
358
-
359
-
360
-
361
-
362
-
363
-
364
-
365
-
366
-
367
-
368
-
369
-
370
-
371
-
372
-
373
-
374
-
375
-
376
-
377
-
378
-
379
-
380
-
381
-
382
-
383
-
384
-
385
-
386
-
387
-
388
-
389
-
390
-
391
-
392
-
393
-
394
-
395
-
396
-
397
-
398
-
399
-
400
-
401
-
402
 |
 |

175
Consolidated
Financial Statements
at 31 December 2011
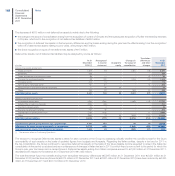
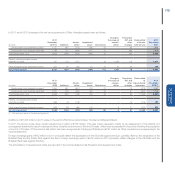
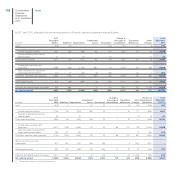
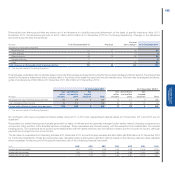
In 2011 and in 2010 changes in the net carrying amount of Other intangible assets were as follows:
(€ million)
At 31
December
2010 (*) Additions
Amorti-
sation
Impairment
losses Divestitures
Change in
the scope of
consoli-
dation
Translation
diff. and
other
changes
Reclassified
to Assets
held for sale
At 31
December
2011
Development costs externally acquired 1,127 681 (270) (38) (2) - 63 - 1,561
Development costs internally generated 1,782 757 (356) (127) (1) - (96) - 1,959
Total Development costs 2,909 1,438 (626) (165) (3) - (33) - 3,520
Patents, concessions and licenses
externally acquired 157 115 (137) - (6) 1,033 115 - 1,277
Other intangible assets externally acquired 201 50 (50) (1) (2) (2) (6) - 190
Net carrying amount 3,267 1,603 (813) (166) (11) 1,031 76 - 4,987
(€ million)
At 31
December
2009 Additions
Amorti-
sation
Impairment
losses Divestitures
Change in
the scope of
consoli-
dation
Translation
diff. and
other
changes
Reclassified
to
Discontinued
Operations
At 31
December
2010 (*)
Development costs externally acquired 1,342 357 (301) (10) (1) - 13 (273) 1,127
Development costs internally generated 2,251 925 (434) (32) (3) - 37 (962) 1,782
Total Development costs 3,593 1,282 (735) (42) (4) - 50 (1,235) 2,909
Patents, concessions and licenses
externally acquired 359 78 (118) - - 1 16 (179) 157
Other intangible assets externally acquired 306 98 (86) (10) - 3 21 (131) 201
Net carrying amount 4,258 1,458 (939) (52) (4) 4 87 (1,545) 3,267
(*) The amounts relate to Continuing Operations.
Additions of €1,603 million in 2011 relate to the sectors Fiat Group Automobiles, Chrysler and Magneti Marelli.
In 2011 the Group wrote-down certain development costs by €165 million. This was made necessary mainly by an assessment of the effects of a
convergence towards the use of a reduced number of platforms common to Fiat and Chrysler, which were accelerated in the period following the acquisition
of control of Chrysler. Of this amount, €4 million has been recognised as Trading profit/(loss) and €161 million as Other unusual income (expenses) in the
income statement.
Foreign exchange gains of €72 million in 2011 principally reflect the appreciation of the US Dollar against the Euro, partially offset by the devaluation of the
Brazilian Real and the Polish Zloty against the Euro. Foreign exchange gains of €100 million in 2010 principally reflect changes in the US Dollar and the
Brazilian Real rates against the Euro.
The amortisation of development costs are reported in the income statement as Research and development costs.