Chrysler 2011 Annual Report Download - page 178
Download and view the complete annual report
Please find page 178 of the 2011 Chrysler annual report below. You can navigate through the pages in the report by either clicking on the pages listed below, or by using the keyword search tool below to find specific information within the annual report.-
 1
1 -
2
-
3
-
4
-
5
-
6
-
7
-
8
-
9
-
10
-
11
-
12
-
13
-
14
-
15
-
16
-
17
-
18
-
19
-
20
-
21
-
22
-
23
-
24
-
25
-
26
-
27
-
28
-
29
-
30
-
31
-
32
-
33
-
34
-
35
-
36
-
37
-
38
-
39
-
40
-
41
-
42
-
43
-
44
-
45
-
46
-
47
-
48
-
49
-
50
-
51
-
52
-
53
-
54
-
55
-
56
-
57
-
58
-
59
-
60
-
61
-
62
-
63
-
64
-
65
-
66
-
67
-
68
-
69
-
70
-
71
-
72
-
73
-
74
-
75
-
76
-
77
-
78
-
79
-
80
-
81
-
82
-
83
-
84
-
85
-
86
-
87
-
88
-
89
-
90
-
91
-
92
-
93
-
94
-
95
-
96
-
97
-
98
-
99
-
100
-
101
-
102
-
103
-
104
-
105
-
106
-
107
-
108
-
109
-
110
-
111
-
112
-
113
-
114
-
115
-
116
-
117
-
118
-
119
-
120
-
121
-
122
-
123
-
124
-
125
-
126
-
127
-
128
-
129
-
130
-
131
-
132
-
133
-
134
-
135
-
136
-
137
-
138
-
139
-
140
-
141
-
142
-
143
-
144
-
145
-
146
-
147
-
148
-
149
-
150
-
151
-
152
-
153
-
154
-
155
-
156
-
157
-
158
-
159
-
160
-
161
-
162
-
163
-
164
-
165
-
166
-
167
-
 168
168 -
 169
169 -
 170
170 -
 171
171 -
 172
172 -
 173
173 -
 174
174 -
 175
175 -
 176
176 -
 177
177 -
 178
178 -
 179
179 -
 180
180 -
 181
181 -
 182
182 -
 183
183 -
 184
184 -
 185
185 -
 186
186 -
 187
187 -
 188
188 -
189
-
190
-
191
-
192
-
193
-
194
-
195
-
196
-
197
-
198
-
199
-
200
-
201
-
202
-
203
-
204
-
205
-
206
-
207
-
208
-
209
-
210
-
211
-
212
-
213
-
214
-
215
-
216
-
217
-
218
-
219
-
220
-
221
-
222
-
223
-
224
-
225
-
226
-
227
-
228
-
229
-
230
-
231
-
232
-
233
-
234
-
235
-
236
-
237
-
238
-
239
-
240
-
241
-
242
-
243
-
244
-
245
-
246
-
247
-
248
-
249
-
250
-
251
-
252
-
253
-
254
-
255
-
256
-
257
-
258
-
259
-
260
-
261
-
262
-
263
-
264
-
265
-
266
-
267
-
268
-
269
-
270
-
271
-
272
-
273
-
274
-
275
-
276
-
277
-
278
-
279
-
280
-
281
-
282
-
283
-
284
-
285
-
286
-
287
-
288
-
289
-
290
-
291
-
292
-
293
-
294
-
295
-
296
-
297
-
298
-
299
-
300
-
301
-
302
-
303
-
304
-
305
-
306
-
307
-
308
-
309
-
310
-
311
-
312
-
313
-
314
-
315
-
316
-
317
-
318
-
319
-
320
-
321
-
322
-
323
-
324
-
325
-
326
-
327
-
328
-
329
-
330
-
331
-
332
-
333
-
334
-
335
-
336
-
337
-
338
-
339
-
340
-
341
-
342
-
343
-
344
-
345
-
346
-
347
-
348
-
349
-
350
-
351
-
352
-
353
-
354
-
355
-
356
-
357
-
358
-
359
-
360
-
361
-
362
-
363
-
364
-
365
-
366
-
367
-
368
-
369
-
370
-
371
-
372
-
373
-
374
-
375
-
376
-
377
-
378
-
379
-
380
-
381
-
382
-
383
-
384
-
385
-
386
-
387
-
388
-
389
-
390
-
391
-
392
-
393
-
394
-
395
-
396
-
397
-
398
-
399
-
400
-
401
-
402
 |
 |
177
Consolidated
Financial Statements
at 31 December 2011
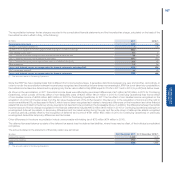
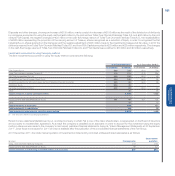
In 2011 and 2010, Changes in accumulated depreciation and impairment losses were as follows:
(€ million)
At 31
December
2010 (*) Depreciation
Impairment
losses Divestitures
Change in
the scope of
consolidation
Translation
differences
Other
changes
At 31
December
2011
Land 7 - - - - - - 7
Owned industrial buildings 1,836 189 35 (12) (1) (44) (4) 1,999
Industrial buildings leased under finance leases 13 2 - (1) - - - 14
Total Industrial buildings 1,849 191 35 (13) (1) (44) (4) 2,013
Owned plant, machinery and equipment 18,150 1,640 281 (831) 13 (330) 20 18,943
Plant, machinery and equipment leased under
finance leases 157 30 4 (85) - (1) - 105
Total Plant, machinery and equipment 18,307 1,670 285 (916) 13 (331) 20 19,048
Other tangible assets 871 684 2 (89) (1) 47 (4) 1,510
Advances and tangible assets in progress 18 - 1 - - - (9) 10
Accumulated depreciation and impairment 21,052 2,545 323 (1,018) 11 (328) 3 22,588
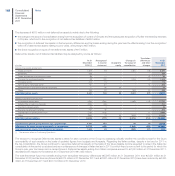
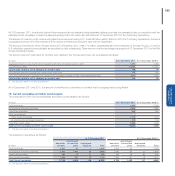
(€ million)
At 31
December
2009 Depreciation
Impairment
losses Divestitures
Change in
the scope of
consolidation
Translation
differences
Other
changes
Reclassified
to
Discontinued
Operations
At 31
December
2010 (*)
Land 9 - 2 (2) - 1 (1) (2) 7
Owned industrial buildings 2,561 182 59 (9) 7 74 15 (1,053) 1,836
Industrial buildings leased under
finance leases 17 2 - (1) - - 2 (7) 13
Total Industrial buildings 2,578 184 59 (10) 7 74 17 (1,060) 1,849
Owned plant, machinery and
equipment 20,813 1,548 73 (542) 92 400 (8) (4,226) 18,150
Plant, machinery and equipment
leased under finance leases 120 44 - - - 1 5 (13) 157
Total Plant, machinery and equipment 20,933 1,592 73 (542) 92 401 (3) (4,239) 18,307
Assets sold with a buy-back
commitment 308 131 26 (76) - 2 (95) (296) -
Other tangible assets 1,344 136 3 (99) (2) 32 1 (544) 871
Advances and tangible assets in progress 16 - 4 - - - (2) - 18
Accumulated depreciation and
impairment 25,188 2,043 167 (729) 97 510 (83) (6,141) 21,052
(*) The amounts relate to Continuing Operations.