Chrysler 2011 Annual Report Download - page 184
Download and view the complete annual report
Please find page 184 of the 2011 Chrysler annual report below. You can navigate through the pages in the report by either clicking on the pages listed below, or by using the keyword search tool below to find specific information within the annual report.-
 1
1 -
2
-
3
-
4
-
5
-
6
-
7
-
8
-
9
-
10
-
11
-
12
-
13
-
14
-
15
-
16
-
17
-
18
-
19
-
20
-
21
-
22
-
23
-
24
-
25
-
26
-
27
-
28
-
29
-
30
-
31
-
32
-
33
-
34
-
35
-
36
-
37
-
38
-
39
-
40
-
41
-
42
-
43
-
44
-
45
-
46
-
47
-
48
-
49
-
50
-
51
-
52
-
53
-
54
-
55
-
56
-
57
-
58
-
59
-
60
-
61
-
62
-
63
-
64
-
65
-
66
-
67
-
68
-
69
-
70
-
71
-
72
-
73
-
74
-
75
-
76
-
77
-
78
-
79
-
80
-
81
-
82
-
83
-
84
-
85
-
86
-
87
-
88
-
89
-
90
-
91
-
92
-
93
-
94
-
95
-
96
-
97
-
98
-
99
-
100
-
101
-
102
-
103
-
104
-
105
-
106
-
107
-
108
-
109
-
110
-
111
-
112
-
113
-
114
-
115
-
116
-
117
-
118
-
119
-
120
-
121
-
122
-
123
-
124
-
125
-
126
-
127
-
128
-
129
-
130
-
131
-
132
-
133
-
134
-
135
-
136
-
137
-
138
-
139
-
140
-
141
-
142
-
143
-
144
-
145
-
146
-
147
-
148
-
149
-
150
-
151
-
152
-
153
-
154
-
155
-
156
-
157
-
158
-
159
-
160
-
161
-
162
-
163
-
164
-
165
-
166
-
167
-
168
-
169
-
170
-
171
-
172
-
173
-
 174
174 -
 175
175 -
 176
176 -
 177
177 -
 178
178 -
 179
179 -
 180
180 -
 181
181 -
 182
182 -
 183
183 -
 184
184 -
 185
185 -
 186
186 -
 187
187 -
 188
188 -
 189
189 -
 190
190 -
 191
191 -
 192
192 -
 193
193 -
 194
194 -
195
-
196
-
197
-
198
-
199
-
200
-
201
-
202
-
203
-
204
-
205
-
206
-
207
-
208
-
209
-
210
-
211
-
212
-
213
-
214
-
215
-
216
-
217
-
218
-
219
-
220
-
221
-
222
-
223
-
224
-
225
-
226
-
227
-
228
-
229
-
230
-
231
-
232
-
233
-
234
-
235
-
236
-
237
-
238
-
239
-
240
-
241
-
242
-
243
-
244
-
245
-
246
-
247
-
248
-
249
-
250
-
251
-
252
-
253
-
254
-
255
-
256
-
257
-
258
-
259
-
260
-
261
-
262
-
263
-
264
-
265
-
266
-
267
-
268
-
269
-
270
-
271
-
272
-
273
-
274
-
275
-
276
-
277
-
278
-
279
-
280
-
281
-
282
-
283
-
284
-
285
-
286
-
287
-
288
-
289
-
290
-
291
-
292
-
293
-
294
-
295
-
296
-
297
-
298
-
299
-
300
-
301
-
302
-
303
-
304
-
305
-
306
-
307
-
308
-
309
-
310
-
311
-
312
-
313
-
314
-
315
-
316
-
317
-
318
-
319
-
320
-
321
-
322
-
323
-
324
-
325
-
326
-
327
-
328
-
329
-
330
-
331
-
332
-
333
-
334
-
335
-
336
-
337
-
338
-
339
-
340
-
341
-
342
-
343
-
344
-
345
-
346
-
347
-
348
-
349
-
350
-
351
-
352
-
353
-
354
-
355
-
356
-
357
-
358
-
359
-
360
-
361
-
362
-
363
-
364
-
365
-
366
-
367
-
368
-
369
-
370
-
371
-
372
-
373
-
374
-
375
-
376
-
377
-
378
-
379
-
380
-
381
-
382
-
383
-
384
-
385
-
386
-
387
-
388
-
389
-
390
-
391
-
392
-
393
-
394
-
395
-
396
-
397
-
398
-
399
-
400
-
401
-
402
 |
 |
183
Consolidated
Financial Statements
at 31 December 2011
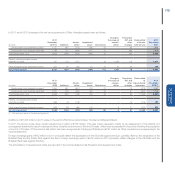
At 31 December 2011, Inventories include those measured at net realisable value (estimated selling price less the estimated costs of completion and the
estimated costs necessary to make the sale) amounting to €1,343 million (€1,482 million at 31 December 2010 for the Continuing Operations).
The amount of inventory write-downs recognised as an expense during 2011 is €528 million (€432 million in 2010 for Continuing Operations). Amounts
recognised as income from the reversal of write-downs on items sold during the year were not significant.
The amount of inventories of the Chrysler sector at 31 December 2011 is €4,170 million. Substantially all of the inventories of Chrysler Group LLC and its
U.S. subsidiary guarantors are pledged as securities for debt outstanding. There were no inventories pledged as security at 31 December 2011 for the Fiat
Group excluding Chrysler.
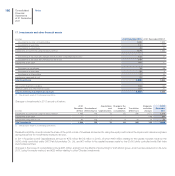
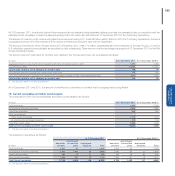
The amount due from customers for contract work relates to the Comau sector and can be analysed as follows:
(€ million) At 31 December 2011 At 31 December 2010 (*)
Aggregate amount of costs incurred and recognised profits (less recognised losses) to date 1,294 1,233
Less: Progress billings (1,230) (1,203)
Construction contracts, net of advances on contract work 64 30
Gross amount due from customers for contract work as an asset 174 135
Less: Gross amount due to customers for contract work as a liability included in Other current liabilities (Note 30) (110) (105)
Construction contracts, net of advances on contract work 64 30
(*) The amounts relate to Continuing Operations.
At 31 December 2011 and 2010, the amount of retentions by customers on contract work in progress was not significant.
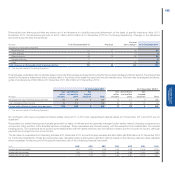
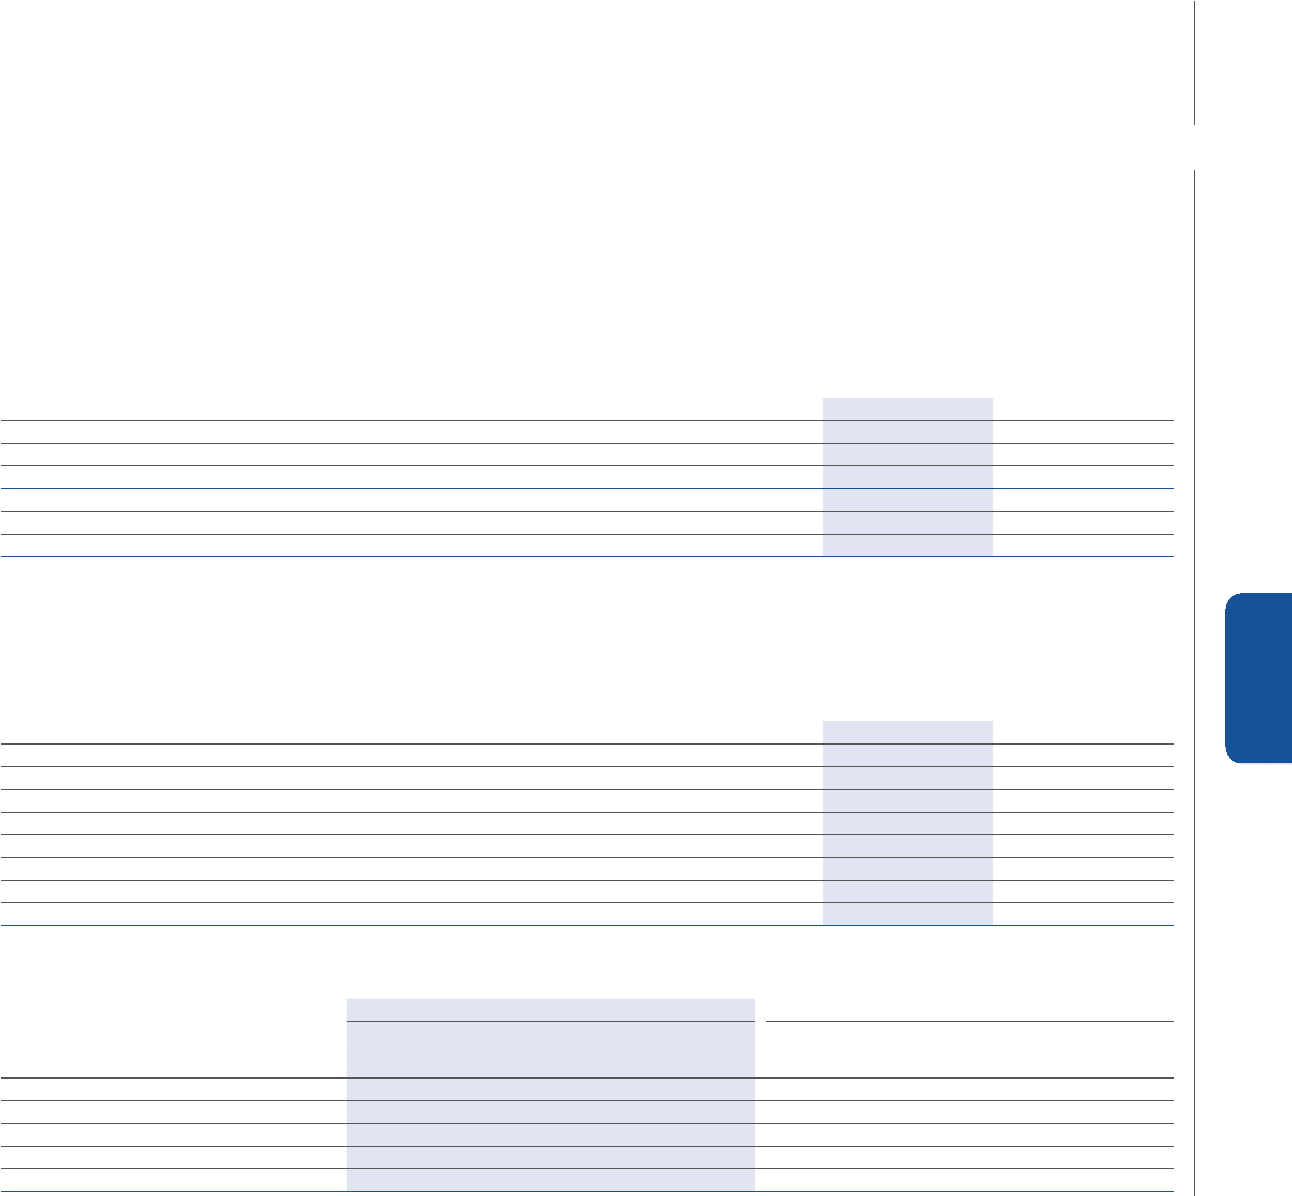
19. Current receivables and Other current assets
The composition of the Current receivables and Other current assets is as follows:
(€ million) At 31 December 2011 At 31 December 2010 (*)
Trade receivables 2,625 2,259
Receivables from financing activities 3,968 2,866
Current tax receivables 369 353
Other current assets:
Other current receivables 1,710 1,410
Accrued income and prepaid expenses 378 118
Total Other current assets 2,088 1,528
Total Current receivables and Other current assets 9,050 7,006
(*) The amounts relate to Continuing Operations.
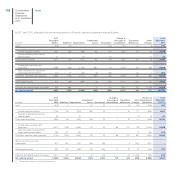
The analysis by due date is as follows:
At 31 December 2011 At 31 December 2010 (*)
(€ million)
due within
one year
due between
one and five
years
due beyond
five years Total
due within
one year
due between
one and five
years
due beyond
five years Total
Trade receivables 2,567 57 1 2,625 2,209 50 - 2,259
Receivables from financing activities 2,943 1,001 24 3,968 2,080 764 22 2,866
Current tax receivables 283 15 71 369 243 28 82 353
Other current receivables 1,340 351 19 1,710 1,200 197 13 1,410
Total Current receivables 7,133 1,424 115 8,672 5,732 1,039 117 6,888
(*) The amounts relate to Continuing Operations.