Chrysler 2011 Annual Report Download - page 232
Download and view the complete annual report
Please find page 232 of the 2011 Chrysler annual report below. You can navigate through the pages in the report by either clicking on the pages listed below, or by using the keyword search tool below to find specific information within the annual report.-
 1
1 -
2
-
3
-
4
-
5
-
6
-
7
-
8
-
9
-
10
-
11
-
12
-
13
-
14
-
15
-
16
-
17
-
18
-
19
-
20
-
21
-
22
-
23
-
24
-
25
-
26
-
27
-
28
-
29
-
30
-
31
-
32
-
33
-
34
-
35
-
36
-
37
-
38
-
39
-
40
-
41
-
42
-
43
-
44
-
45
-
46
-
47
-
48
-
49
-
50
-
51
-
52
-
53
-
54
-
55
-
56
-
57
-
58
-
59
-
60
-
61
-
62
-
63
-
64
-
65
-
66
-
67
-
68
-
69
-
70
-
71
-
72
-
73
-
74
-
75
-
76
-
77
-
78
-
79
-
80
-
81
-
82
-
83
-
84
-
85
-
86
-
87
-
88
-
89
-
90
-
91
-
92
-
93
-
94
-
95
-
96
-
97
-
98
-
99
-
100
-
101
-
102
-
103
-
104
-
105
-
106
-
107
-
108
-
109
-
110
-
111
-
112
-
113
-
114
-
115
-
116
-
117
-
118
-
119
-
120
-
121
-
122
-
123
-
124
-
125
-
126
-
127
-
128
-
129
-
130
-
131
-
132
-
133
-
134
-
135
-
136
-
137
-
138
-
139
-
140
-
141
-
142
-
143
-
144
-
145
-
146
-
147
-
148
-
149
-
150
-
151
-
152
-
153
-
154
-
155
-
156
-
157
-
158
-
159
-
160
-
161
-
162
-
163
-
164
-
165
-
166
-
167
-
168
-
169
-
170
-
171
-
172
-
173
-
174
-
175
-
176
-
177
-
178
-
179
-
180
-
181
-
182
-
183
-
184
-
185
-
186
-
187
-
188
-
189
-
190
-
191
-
192
-
193
-
194
-
195
-
196
-
197
-
198
-
199
-
200
-
201
-
202
-
203
-
204
-
205
-
206
-
207
-
208
-
209
-
210
-
211
-
212
-
213
-
214
-
215
-
216
-
217
-
218
-
219
-
220
-
221
-
 222
222 -
 223
223 -
 224
224 -
 225
225 -
 226
226 -
 227
227 -
 228
228 -
 229
229 -
 230
230 -
 231
231 -
 232
232 -
 233
233 -
 234
234 -
 235
235 -
 236
236 -
 237
237 -
 238
238 -
 239
239 -
 240
240 -
 241
241 -
 242
242 -
243
-
244
-
245
-
246
-
247
-
248
-
249
-
250
-
251
-
252
-
253
-
254
-
255
-
256
-
257
-
258
-
259
-
260
-
261
-
262
-
263
-
264
-
265
-
266
-
267
-
268
-
269
-
270
-
271
-
272
-
273
-
274
-
275
-
276
-
277
-
278
-
279
-
280
-
281
-
282
-
283
-
284
-
285
-
286
-
287
-
288
-
289
-
290
-
291
-
292
-
293
-
294
-
295
-
296
-
297
-
298
-
299
-
300
-
301
-
302
-
303
-
304
-
305
-
306
-
307
-
308
-
309
-
310
-
311
-
312
-
313
-
314
-
315
-
316
-
317
-
318
-
319
-
320
-
321
-
322
-
323
-
324
-
325
-
326
-
327
-
328
-
329
-
330
-
331
-
332
-
333
-
334
-
335
-
336
-
337
-
338
-
339
-
340
-
341
-
342
-
343
-
344
-
345
-
346
-
347
-
348
-
349
-
350
-
351
-
352
-
353
-
354
-
355
-
356
-
357
-
358
-
359
-
360
-
361
-
362
-
363
-
364
-
365
-
366
-
367
-
368
-
369
-
370
-
371
-
372
-
373
-
374
-
375
-
376
-
377
-
378
-
379
-
380
-
381
-
382
-
383
-
384
-
385
-
386
-
387
-
388
-
389
-
390
-
391
-
392
-
393
-
394
-
395
-
396
-
397
-
398
-
399
-
400
-
401
-
402
 |
 |

231
Consolidated
Financial Statements
at 31 December 2011
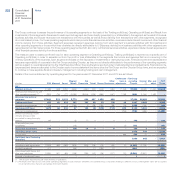
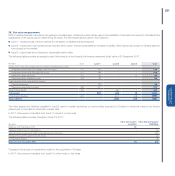
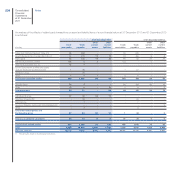
36. Fair value measurement
IFRS 7 requires financial instruments recognised in the statement of financial position at fair value to be classified on the basis of a hierarchy that reflects the
significance of the inputs used in determining fair value. The following levels are used in this hierarchy:
Level 1 – quoted prices in active markets for the assets or liabilities being measured;
Level 2 – inputs other than quoted prices included within Level 1 that are observable for the asset or liability, either directly (as prices) or indirectly (derived
from prices) on the market;
Level 3 – inputs that are not based on observable market data.
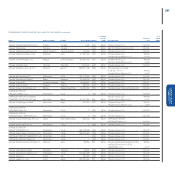
The following table provides an analysis under this hierarchy of the financial instruments measured at fair value at 31 December 2011.
(€ million) Note Level 1 Level 2 Level 3 Total
Assets at fair value with changes directly in Other comprehensive income:
Investments at fair value with changes directly in equity (17) 116 - - 116
Investments at fair value through profit or loss (17) 149 - - 149
Other non-current securities (17) 32 - 12 44
Current securities available-for-sale (20) 52 - - 52
Financial assets at fair value held-for-trading:
Current investments 33 - - 33
Current securities held for trading (20) 147 - - 147
Other financial assets (21) - 482 1 483
Total Assets 529 482 13 1,024
Other financial liabilities (21) - (401) (28) (429)
Total Liabilities - (401) (28) (429)
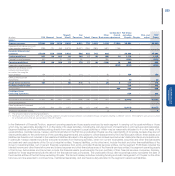
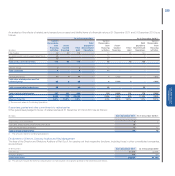
The other assets and liabilities classified in Level 3 relate to certain derivatives on commodities acquired by Chrysler for which fair value is not directly
determined on the basis of observable market data.
In 2011, there were no transfers from Level 1 to Level 2 or vice versa.
The following table provides changes in Level 3 in 2011:
(€ million)
Other non-current
securities
Other financial assets/
(liabilities)
Balances at 31 December 2010 12 -
Changes in the scope of consolidation - 15
Gains/(Losses) recognised in Other comprehensive income/(loss) - (31)
(Gains) and losses recognised in profit or loss - (3)
Increases/(Decreases) - (8)
Balances at 31 December 2011 12 (27)
Changes in the scope of consolidation relate to the acquisition of Chrysler.
In 2011, there were no transfers from Level 3 to other levels or vice versa.