Chrysler 2011 Annual Report Download - page 223
Download and view the complete annual report
Please find page 223 of the 2011 Chrysler annual report below. You can navigate through the pages in the report by either clicking on the pages listed below, or by using the keyword search tool below to find specific information within the annual report.-
 1
1 -
2
-
3
-
4
-
5
-
6
-
7
-
8
-
9
-
10
-
11
-
12
-
13
-
14
-
15
-
16
-
17
-
18
-
19
-
20
-
21
-
22
-
23
-
24
-
25
-
26
-
27
-
28
-
29
-
30
-
31
-
32
-
33
-
34
-
35
-
36
-
37
-
38
-
39
-
40
-
41
-
42
-
43
-
44
-
45
-
46
-
47
-
48
-
49
-
50
-
51
-
52
-
53
-
54
-
55
-
56
-
57
-
58
-
59
-
60
-
61
-
62
-
63
-
64
-
65
-
66
-
67
-
68
-
69
-
70
-
71
-
72
-
73
-
74
-
75
-
76
-
77
-
78
-
79
-
80
-
81
-
82
-
83
-
84
-
85
-
86
-
87
-
88
-
89
-
90
-
91
-
92
-
93
-
94
-
95
-
96
-
97
-
98
-
99
-
100
-
101
-
102
-
103
-
104
-
105
-
106
-
107
-
108
-
109
-
110
-
111
-
112
-
113
-
114
-
115
-
116
-
117
-
118
-
119
-
120
-
121
-
122
-
123
-
124
-
125
-
126
-
127
-
128
-
129
-
130
-
131
-
132
-
133
-
134
-
135
-
136
-
137
-
138
-
139
-
140
-
141
-
142
-
143
-
144
-
145
-
146
-
147
-
148
-
149
-
150
-
151
-
152
-
153
-
154
-
155
-
156
-
157
-
158
-
159
-
160
-
161
-
162
-
163
-
164
-
165
-
166
-
167
-
168
-
169
-
170
-
171
-
172
-
173
-
174
-
175
-
176
-
177
-
178
-
179
-
180
-
181
-
182
-
183
-
184
-
185
-
186
-
187
-
188
-
189
-
190
-
191
-
192
-
193
-
194
-
195
-
196
-
197
-
198
-
199
-
200
-
201
-
202
-
203
-
204
-
205
-
206
-
207
-
208
-
209
-
210
-
211
-
212
-
 213
213 -
 214
214 -
 215
215 -
 216
216 -
 217
217 -
 218
218 -
 219
219 -
 220
220 -
 221
221 -
 222
222 -
 223
223 -
 224
224 -
 225
225 -
 226
226 -
 227
227 -
 228
228 -
 229
229 -
 230
230 -
 231
231 -
 232
232 -
 233
233 -
234
-
235
-
236
-
237
-
238
-
239
-
240
-
241
-
242
-
243
-
244
-
245
-
246
-
247
-
248
-
249
-
250
-
251
-
252
-
253
-
254
-
255
-
256
-
257
-
258
-
259
-
260
-
261
-
262
-
263
-
264
-
265
-
266
-
267
-
268
-
269
-
270
-
271
-
272
-
273
-
274
-
275
-
276
-
277
-
278
-
279
-
280
-
281
-
282
-
283
-
284
-
285
-
286
-
287
-
288
-
289
-
290
-
291
-
292
-
293
-
294
-
295
-
296
-
297
-
298
-
299
-
300
-
301
-
302
-
303
-
304
-
305
-
306
-
307
-
308
-
309
-
310
-
311
-
312
-
313
-
314
-
315
-
316
-
317
-
318
-
319
-
320
-
321
-
322
-
323
-
324
-
325
-
326
-
327
-
328
-
329
-
330
-
331
-
332
-
333
-
334
-
335
-
336
-
337
-
338
-
339
-
340
-
341
-
342
-
343
-
344
-
345
-
346
-
347
-
348
-
349
-
350
-
351
-
352
-
353
-
354
-
355
-
356
-
357
-
358
-
359
-
360
-
361
-
362
-
363
-
364
-
365
-
366
-
367
-
368
-
369
-
370
-
371
-
372
-
373
-
374
-
375
-
376
-
377
-
378
-
379
-
380
-
381
-
382
-
383
-
384
-
385
-
386
-
387
-
388
-
389
-
390
-
391
-
392
-
393
-
394
-
395
-
396
-
397
-
398
-
399
-
400
-
401
-
402
 |
 |

Consolidated
Financial
Statements
at 31 December
2011
Notes
222
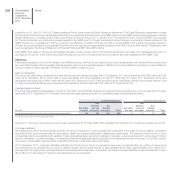
The Group continues to assess the performance of its operating segments on the basis of the Trading profit/(loss), Operating profit/(loss) and Result from
investments of those segments. Revenues for each reported segment are those directly generated by or attributable to the segment as the result of its usual
business activities and include revenues from transactions with third parties as well as those deriving from transactions with other segments, recognised
at normal market prices. For those operating segments which also provide financial services activities, revenues include interest income and other financial
income deriving from those activities. Segment expenses represent expenses deriving from each segment’s business activities with third parties and
other operating segments or those which may otherwise be directly attributable to it. Expenses deriving from business activities with other segments are
recognised at normal market prices. For those operating segments which also carry out financial services activities, expenses include interest expense and
other financial expense deriving from those activities.
The measure used to assess profit and loss for each operating segment is Operating profit/(loss). Trading profit/(loss) is reported as a specific part of
Operating profit/(loss) in order to separate out from the profit or loss attributable to the segments the income and expense that is non-recurring in the
ordinary operations of the business, such as gains and losses on the disposals of investments or restructuring costs. Financial income and expenses and
taxes are responsibility of corporate in the Fiat Group excluding Chrysler, as they are not directly attributable to the performance of the operating segments
and are subject to overall assessment by the Chief Executive Officer: they are therefore reported under Unallocated items and adjustments. Financial income
(expenses) and taxes are allocated to the Chrysler sector income statement line items since the Fiat Group and the Chrysler Group have, and are expected
to continue to have separate fiscal and treasury management, including funding and cash management.
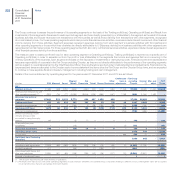
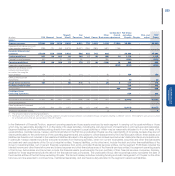
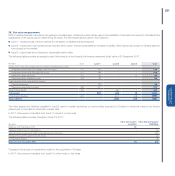
Details of the income statement by operating segment for the years ended 31 December 2011 and 2010 are as follows:
(€ million) FGA Maserati Ferrari
Magneti
Marelli
Fiat
Powertrain Teksid Comau
Other
Businesses
Unallocated
items &
adjustments
Fiat Group
excluding
Chrysler
Chrysler
(*)
Elim. and
adjust
FIAT
Group
2011
Segment revenues 27,980 588 2,251 5,860 4,450 922 1,402 1,082 (7,153) 37,382 23,609 (1,432) 59,559
Revenues from transactions with
other operating segments (**) (320) (76) (77) (2,090) (3,816) (225) (380) (457) 7,153 (288) (1,144) 1,432 -
Revenues from external
customers 27,660 512 2,174 3,770 634 697 1,022 625 - 37,094 22,465 - 59,559
Trading profit/(loss) 430 40 312 181 131 26 10 (79) (4) 1,047 1,345 - 2,392
Unusual income/(expense) 1,446 - 6 (154) 3 (28) (130) (38) (16) 1,089 (145) - 944
Operating profit/(loss) 1,876 40 318 27 134 (2) (120) (117) (20) 2,136 1,200 - 3,336
Financial income/(expense) (796) (796) (486) - (1,282)
Interest in profit/(loss) of joint
ventures and associates
accounted for using the equity
method 145 - - (3) (7) 3 - 6 1 145 1 - 146
Other profit/(loss) from
investments 1 - - (15) - - - - (1) (15) - - (15)
Result from investments 146 - - (18) (7) 3 - 6 - 130 1 - 131
Profit/(loss) before taxes 1,470 715 - 2,185
Income taxes 464 464 70 - 534
Profit/(loss) from Continuing
Operations 1,006 645 - 1,651
Amortisation and depreciation (1,233) (68) (269) (303) (284) (28) (14) (34) (2) (2,235) (1,123) - (3,358)
Goodwill impairment (17) - - (69) - (7) (130) (1) - (224) - - (224)
Other impairments losses and
other non-cash items (1,924) (51) (69) (158) (135) (42) (26) (127) (10) (2,542) (3,901) - (6,443)
Reversal of impairment losses - - - 1 - - - - - 1- - 1
(*) The amounts reported include seven months of operations.
(**) Revenues from transactions with other operating segments include revenues between consolidated Group companies relating to different sectors. Intersegment sales are accounted
for at transfer prices that are substantially in line with market.