Chrysler 2011 Annual Report Download - page 191
Download and view the complete annual report
Please find page 191 of the 2011 Chrysler annual report below. You can navigate through the pages in the report by either clicking on the pages listed below, or by using the keyword search tool below to find specific information within the annual report.-
 1
1 -
2
-
3
-
4
-
5
-
6
-
7
-
8
-
9
-
10
-
11
-
12
-
13
-
14
-
15
-
16
-
17
-
18
-
19
-
20
-
21
-
22
-
23
-
24
-
25
-
26
-
27
-
28
-
29
-
30
-
31
-
32
-
33
-
34
-
35
-
36
-
37
-
38
-
39
-
40
-
41
-
42
-
43
-
44
-
45
-
46
-
47
-
48
-
49
-
50
-
51
-
52
-
53
-
54
-
55
-
56
-
57
-
58
-
59
-
60
-
61
-
62
-
63
-
64
-
65
-
66
-
67
-
68
-
69
-
70
-
71
-
72
-
73
-
74
-
75
-
76
-
77
-
78
-
79
-
80
-
81
-
82
-
83
-
84
-
85
-
86
-
87
-
88
-
89
-
90
-
91
-
92
-
93
-
94
-
95
-
96
-
97
-
98
-
99
-
100
-
101
-
102
-
103
-
104
-
105
-
106
-
107
-
108
-
109
-
110
-
111
-
112
-
113
-
114
-
115
-
116
-
117
-
118
-
119
-
120
-
121
-
122
-
123
-
124
-
125
-
126
-
127
-
128
-
129
-
130
-
131
-
132
-
133
-
134
-
135
-
136
-
137
-
138
-
139
-
140
-
141
-
142
-
143
-
144
-
145
-
146
-
147
-
148
-
149
-
150
-
151
-
152
-
153
-
154
-
155
-
156
-
157
-
158
-
159
-
160
-
161
-
162
-
163
-
164
-
165
-
166
-
167
-
168
-
169
-
170
-
171
-
172
-
173
-
174
-
175
-
176
-
177
-
178
-
179
-
180
-
 181
181 -
 182
182 -
 183
183 -
 184
184 -
 185
185 -
 186
186 -
 187
187 -
 188
188 -
 189
189 -
 190
190 -
 191
191 -
 192
192 -
 193
193 -
 194
194 -
 195
195 -
 196
196 -
 197
197 -
 198
198 -
 199
199 -
 200
200 -
 201
201 -
202
-
203
-
204
-
205
-
206
-
207
-
208
-
209
-
210
-
211
-
212
-
213
-
214
-
215
-
216
-
217
-
218
-
219
-
220
-
221
-
222
-
223
-
224
-
225
-
226
-
227
-
228
-
229
-
230
-
231
-
232
-
233
-
234
-
235
-
236
-
237
-
238
-
239
-
240
-
241
-
242
-
243
-
244
-
245
-
246
-
247
-
248
-
249
-
250
-
251
-
252
-
253
-
254
-
255
-
256
-
257
-
258
-
259
-
260
-
261
-
262
-
263
-
264
-
265
-
266
-
267
-
268
-
269
-
270
-
271
-
272
-
273
-
274
-
275
-
276
-
277
-
278
-
279
-
280
-
281
-
282
-
283
-
284
-
285
-
286
-
287
-
288
-
289
-
290
-
291
-
292
-
293
-
294
-
295
-
296
-
297
-
298
-
299
-
300
-
301
-
302
-
303
-
304
-
305
-
306
-
307
-
308
-
309
-
310
-
311
-
312
-
313
-
314
-
315
-
316
-
317
-
318
-
319
-
320
-
321
-
322
-
323
-
324
-
325
-
326
-
327
-
328
-
329
-
330
-
331
-
332
-
333
-
334
-
335
-
336
-
337
-
338
-
339
-
340
-
341
-
342
-
343
-
344
-
345
-
346
-
347
-
348
-
349
-
350
-
351
-
352
-
353
-
354
-
355
-
356
-
357
-
358
-
359
-
360
-
361
-
362
-
363
-
364
-
365
-
366
-
367
-
368
-
369
-
370
-
371
-
372
-
373
-
374
-
375
-
376
-
377
-
378
-
379
-
380
-
381
-
382
-
383
-
384
-
385
-
386
-
387
-
388
-
389
-
390
-
391
-
392
-
393
-
394
-
395
-
396
-
397
-
398
-
399
-
400
-
401
-
402
 |
 |

Consolidated
Financial
Statements
at 31 December
2011
Notes
190
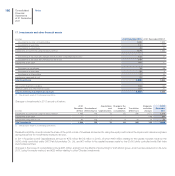
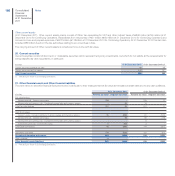
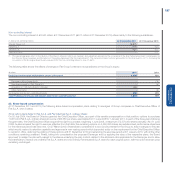
22. Cash and cash equivalents
At 31 December 2011 Cash and cash equivalent amounts to €17,526 million, of which €7,420 million relating to Chrysler, and consist of:
(€ million) At 31 December 2011 At 31 December 2010 (*)
Cash at banks (**) 9,383 8,417
Money market securities 8,143 3,550
Total Cash and cash equivalents 17,526 11,967
(*) The amounts relate to Continuing Operations.
(**) Includes bank deposits which may be used exclusively by Group companies entitled to perform specific operations (cash with a pre-determined use) amounting to 1 million
euros at 31 December 2011 (10 million euros at 31 December 2010).
Amounts shown are readily convertible into cash and are subject to an insignificant risk of changes in value, and consist of balances spread across various
primary national and international banking institutions, liquid funds and other money market instruments.
The carrying amount of cash and cash equivalents is in line with their fair value at the balance sheet date.
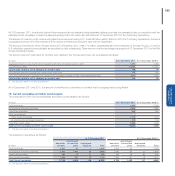
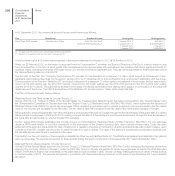
23. Assets and liabilities held for sale and Discontinuing Operations
Assets and liabilities held for sale at 31 December 2011 include the investment in a small company in Brazil, which was classified as held for sale on
acquisition, together with certain properties allocated to the Other businesses.
In addition to the above mentioned investment, at 31 December 2010 Assets and liabilities held for sale and Discontinued Operations included certain
properties of the Fiat Group Automobiles sector and the assets and liabilities of businesses transferred to the Fiat Industrial Group through the Demerger,
as described in the Section – Fiat Demerger and Discontinued Operations. These assets and liabilities were classified and presented as Discontinued
Operations in the Fiat Group’s Consolidated Financial Statements for the year ended 31 December 2010. Details of the methods used to prepare that
statement in accordance with IFRS 5 may be found in the paragraph – Fiat Demerger and Discontinued Operations in those statements.
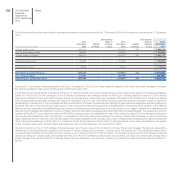
The items included in Assets and Liabilities held for sale may be summarised as follows:
(€ million) At 31 December 2011 At 31 December 2010
Property, plant and equipment 63
Investments and other financial assets 60 65
Total Assets held for sale 66 68
Assets classified as Discontinued Operations -34,786
Total Liabilities held for sale --
Liabilities classified as Discontinued Operations -29,920