Chrysler 2011 Annual Report Download - page 236
Download and view the complete annual report
Please find page 236 of the 2011 Chrysler annual report below. You can navigate through the pages in the report by either clicking on the pages listed below, or by using the keyword search tool below to find specific information within the annual report.-
 1
1 -
2
-
3
-
4
-
5
-
6
-
7
-
8
-
9
-
10
-
11
-
12
-
13
-
14
-
15
-
16
-
17
-
18
-
19
-
20
-
21
-
22
-
23
-
24
-
25
-
26
-
27
-
28
-
29
-
30
-
31
-
32
-
33
-
34
-
35
-
36
-
37
-
38
-
39
-
40
-
41
-
42
-
43
-
44
-
45
-
46
-
47
-
48
-
49
-
50
-
51
-
52
-
53
-
54
-
55
-
56
-
57
-
58
-
59
-
60
-
61
-
62
-
63
-
64
-
65
-
66
-
67
-
68
-
69
-
70
-
71
-
72
-
73
-
74
-
75
-
76
-
77
-
78
-
79
-
80
-
81
-
82
-
83
-
84
-
85
-
86
-
87
-
88
-
89
-
90
-
91
-
92
-
93
-
94
-
95
-
96
-
97
-
98
-
99
-
100
-
101
-
102
-
103
-
104
-
105
-
106
-
107
-
108
-
109
-
110
-
111
-
112
-
113
-
114
-
115
-
116
-
117
-
118
-
119
-
120
-
121
-
122
-
123
-
124
-
125
-
126
-
127
-
128
-
129
-
130
-
131
-
132
-
133
-
134
-
135
-
136
-
137
-
138
-
139
-
140
-
141
-
142
-
143
-
144
-
145
-
146
-
147
-
148
-
149
-
150
-
151
-
152
-
153
-
154
-
155
-
156
-
157
-
158
-
159
-
160
-
161
-
162
-
163
-
164
-
165
-
166
-
167
-
168
-
169
-
170
-
171
-
172
-
173
-
174
-
175
-
176
-
177
-
178
-
179
-
180
-
181
-
182
-
183
-
184
-
185
-
186
-
187
-
188
-
189
-
190
-
191
-
192
-
193
-
194
-
195
-
196
-
197
-
198
-
199
-
200
-
201
-
202
-
203
-
204
-
205
-
206
-
207
-
208
-
209
-
210
-
211
-
212
-
213
-
214
-
215
-
216
-
217
-
218
-
219
-
220
-
221
-
222
-
223
-
224
-
225
-
 226
226 -
 227
227 -
 228
228 -
 229
229 -
 230
230 -
 231
231 -
 232
232 -
 233
233 -
 234
234 -
 235
235 -
 236
236 -
 237
237 -
 238
238 -
 239
239 -
 240
240 -
 241
241 -
 242
242 -
 243
243 -
 244
244 -
 245
245 -
 246
246 -
247
-
248
-
249
-
250
-
251
-
252
-
253
-
254
-
255
-
256
-
257
-
258
-
259
-
260
-
261
-
262
-
263
-
264
-
265
-
266
-
267
-
268
-
269
-
270
-
271
-
272
-
273
-
274
-
275
-
276
-
277
-
278
-
279
-
280
-
281
-
282
-
283
-
284
-
285
-
286
-
287
-
288
-
289
-
290
-
291
-
292
-
293
-
294
-
295
-
296
-
297
-
298
-
299
-
300
-
301
-
302
-
303
-
304
-
305
-
306
-
307
-
308
-
309
-
310
-
311
-
312
-
313
-
314
-
315
-
316
-
317
-
318
-
319
-
320
-
321
-
322
-
323
-
324
-
325
-
326
-
327
-
328
-
329
-
330
-
331
-
332
-
333
-
334
-
335
-
336
-
337
-
338
-
339
-
340
-
341
-
342
-
343
-
344
-
345
-
346
-
347
-
348
-
349
-
350
-
351
-
352
-
353
-
354
-
355
-
356
-
357
-
358
-
359
-
360
-
361
-
362
-
363
-
364
-
365
-
366
-
367
-
368
-
369
-
370
-
371
-
372
-
373
-
374
-
375
-
376
-
377
-
378
-
379
-
380
-
381
-
382
-
383
-
384
-
385
-
386
-
387
-
388
-
389
-
390
-
391
-
392
-
393
-
394
-
395
-
396
-
397
-
398
-
399
-
400
-
401
-
402
 |
 |

235
Consolidated
Financial Statements
at 31 December 2011
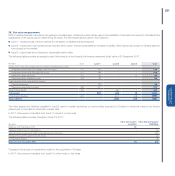
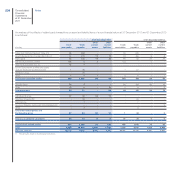
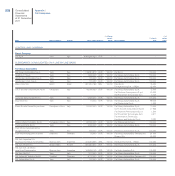
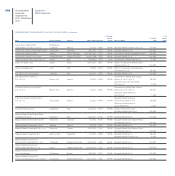
An analysis of the effects of related party transactions on asset and liability items of a financial nature at 31 December 2011 and 31 December 2010 is as
follows:
At 31 December 2011 At 31 December 2010 (*)
(€ million)
Current
Receivables
from
financing
activities
Asset-
backed
financing
Other
debt
Debt
payable to
Discontinued
Operations
Current
Receivables
from
financing
activities
Asset-
backed
financing
Other
debt
Debt
payable to
Discontinued
Operations
Current
Receivables
from
financing
activities
FGA Capital 32 92 118 - 12 - 92 144 -
Società Europea Veicoli Leggeri-Sevel S.p.A. 45 - - - 14 - - 2 -
Other 37 - - - 37 - - - -
Total jointly-controlled entities 114 92 118 - 63 - 92 146 -
Chrysler Group 2 - 4 - 17 - - - -
Total associates 2 - 4 - 17 - - - -
Fiat Industrial group 43 9 68 - 4 5,626 9 - 2,865
Total other related parties and Fiat
Industrial group 43 9 68 - 4 5,626 9 - 2,865
Total unconsolidated subsidiaries 38 - 40 - 45 - - 32 -
Total of which related parties 197 101 230 - 129 5,626 101 178 2,865
Total 3,968 710 26,062 - 2,866 5,626 533 17,406 2,865
Effect on Total (%) 5.0% 14.2% 0.9% - 4.5% 100% 18.9% 1.0% 100%
(*) The amounts relate to Continuing Operations.
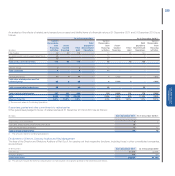
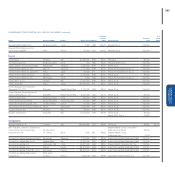
Guarantees granted and other commitments to related parties
Other guarantees pledged in favour of related parties at 31 December 2011and 2010 are as follows:
(€ million) At 31 December 2011 At 31 December 2010 (*)
Total jointly-controlled entities 84
Total other related parties and Fiat Industrial group 10 -
Total unconsolidated subsidiaries 12 12
Total of which related parties 30 16
(*) The amounts relate to Continuing Operations.
Emoluments to Directors, Statutory Auditors and Key Management
The fees of the Director and Statutory Auditors of Fiat S.p.A. for carrying out their respective functions, including those in other consolidated companies,
are as follows:
(in € thousands) At 31 December 2011 At 31 December 2010
Directors (a) 24,570 32,896
Statutory auditors 260 260
Total Emoluments 24,830 33,156
(a) This amount includes the notional compensation cost arising from stock grants granted to the Chief Executive Officer.