Chrysler 2011 Annual Report Download - page 192
Download and view the complete annual report
Please find page 192 of the 2011 Chrysler annual report below. You can navigate through the pages in the report by either clicking on the pages listed below, or by using the keyword search tool below to find specific information within the annual report.-
 1
1 -
2
-
3
-
4
-
5
-
6
-
7
-
8
-
9
-
10
-
11
-
12
-
13
-
14
-
15
-
16
-
17
-
18
-
19
-
20
-
21
-
22
-
23
-
24
-
25
-
26
-
27
-
28
-
29
-
30
-
31
-
32
-
33
-
34
-
35
-
36
-
37
-
38
-
39
-
40
-
41
-
42
-
43
-
44
-
45
-
46
-
47
-
48
-
49
-
50
-
51
-
52
-
53
-
54
-
55
-
56
-
57
-
58
-
59
-
60
-
61
-
62
-
63
-
64
-
65
-
66
-
67
-
68
-
69
-
70
-
71
-
72
-
73
-
74
-
75
-
76
-
77
-
78
-
79
-
80
-
81
-
82
-
83
-
84
-
85
-
86
-
87
-
88
-
89
-
90
-
91
-
92
-
93
-
94
-
95
-
96
-
97
-
98
-
99
-
100
-
101
-
102
-
103
-
104
-
105
-
106
-
107
-
108
-
109
-
110
-
111
-
112
-
113
-
114
-
115
-
116
-
117
-
118
-
119
-
120
-
121
-
122
-
123
-
124
-
125
-
126
-
127
-
128
-
129
-
130
-
131
-
132
-
133
-
134
-
135
-
136
-
137
-
138
-
139
-
140
-
141
-
142
-
143
-
144
-
145
-
146
-
147
-
148
-
149
-
150
-
151
-
152
-
153
-
154
-
155
-
156
-
157
-
158
-
159
-
160
-
161
-
162
-
163
-
164
-
165
-
166
-
167
-
168
-
169
-
170
-
171
-
172
-
173
-
174
-
175
-
176
-
177
-
178
-
179
-
180
-
181
-
 182
182 -
 183
183 -
 184
184 -
 185
185 -
 186
186 -
 187
187 -
 188
188 -
 189
189 -
 190
190 -
 191
191 -
 192
192 -
 193
193 -
 194
194 -
 195
195 -
 196
196 -
 197
197 -
 198
198 -
 199
199 -
 200
200 -
 201
201 -
 202
202 -
203
-
204
-
205
-
206
-
207
-
208
-
209
-
210
-
211
-
212
-
213
-
214
-
215
-
216
-
217
-
218
-
219
-
220
-
221
-
222
-
223
-
224
-
225
-
226
-
227
-
228
-
229
-
230
-
231
-
232
-
233
-
234
-
235
-
236
-
237
-
238
-
239
-
240
-
241
-
242
-
243
-
244
-
245
-
246
-
247
-
248
-
249
-
250
-
251
-
252
-
253
-
254
-
255
-
256
-
257
-
258
-
259
-
260
-
261
-
262
-
263
-
264
-
265
-
266
-
267
-
268
-
269
-
270
-
271
-
272
-
273
-
274
-
275
-
276
-
277
-
278
-
279
-
280
-
281
-
282
-
283
-
284
-
285
-
286
-
287
-
288
-
289
-
290
-
291
-
292
-
293
-
294
-
295
-
296
-
297
-
298
-
299
-
300
-
301
-
302
-
303
-
304
-
305
-
306
-
307
-
308
-
309
-
310
-
311
-
312
-
313
-
314
-
315
-
316
-
317
-
318
-
319
-
320
-
321
-
322
-
323
-
324
-
325
-
326
-
327
-
328
-
329
-
330
-
331
-
332
-
333
-
334
-
335
-
336
-
337
-
338
-
339
-
340
-
341
-
342
-
343
-
344
-
345
-
346
-
347
-
348
-
349
-
350
-
351
-
352
-
353
-
354
-
355
-
356
-
357
-
358
-
359
-
360
-
361
-
362
-
363
-
364
-
365
-
366
-
367
-
368
-
369
-
370
-
371
-
372
-
373
-
374
-
375
-
376
-
377
-
378
-
379
-
380
-
381
-
382
-
383
-
384
-
385
-
386
-
387
-
388
-
389
-
390
-
391
-
392
-
393
-
394
-
395
-
396
-
397
-
398
-
399
-
400
-
401
-
402
 |
 |

191
Consolidated
Financial Statements
at 31 December 2011
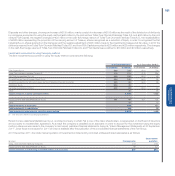
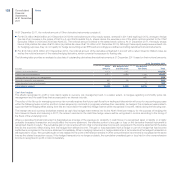
Key financial and income statement data for Discontinued Operations for the period ended at 31 December 2010 are as follows:
(€ million) At 31 December 2010
Total non-current assets 10,029
Total current assets 24,746
Total assets 34,786
Liabilities 29,920
(€ million) 2010
Net revenues 21,342
Operating profit/(loss) 1,017
Profit/(loss) before taxes 576
Income taxes 198
Profit/(loss) for the period 378
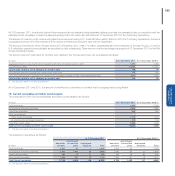
24. Equity
Consolidated equity at 31 December 2011 decreased by €201 million over 31 December 2010, due principally to the Demerger for €4,533 million, a
decrease of €152 million resulting from the distribution of dividends by Fiat S.p.A. and a decrease totalling €509 million arising from exercising the UST Call
Option on the 6.031% fully-diluted ownership interest in Chrysler and the acquisition of the 1.508% fully-diluted ownership interest in Chrysler held by the
Canadian government. These decreases were partially offset by the recognition, at the date of the acquisition of control, of the non-controlling interests of
Chrysler amounting to €3,112 million (see the paragraph – Investment in Chrysler) and by the profit for the period of €1,651 million.
Share capital
At 31 December 2011, fully paid-up share capital amounts to €4,466 million (€6,377 million at 31 December 2010). As a result of the Demerger, on 1
January 2011 the share capital of Fiat S.p.A. decreased by €1,913 million. This took place through a reduction in par value, for all share classes, from
€5.00 per share to €3.5 per share. The reduction in par value of Fiat S.p.A. shares was a consequence of the issue of shares of Fiat Industrial S.p.A. for
no consideration (at a par value of €1.5 each), equivalent in number to the Fiat S.p.A. shares outstanding in each class at the Demerger date. These newly
issued shares were allotted to Fiat S.p.A. shareholders on the basis of one share for each share of the same class in Fiat S.p.A. already held.
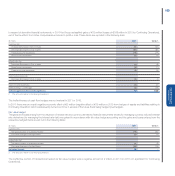
The share capital of Fiat S.p.A. is as follows:
(number of shares) At 31 December 2011 At 31 December 2010
Ordinary shares 1,092,680,610 1,092,247,485
Preference shares 103,292,310 103,292,310
Savings shares 79,912,800 79,912,800
Total shares issued 1,275,885,720 1,275,452,595