Chrysler 2011 Annual Report Download - page 378
Download and view the complete annual report
Please find page 378 of the 2011 Chrysler annual report below. You can navigate through the pages in the report by either clicking on the pages listed below, or by using the keyword search tool below to find specific information within the annual report.-
 1
1 -
2
-
3
-
4
-
5
-
6
-
7
-
8
-
9
-
10
-
11
-
12
-
13
-
14
-
15
-
16
-
17
-
18
-
19
-
20
-
21
-
22
-
23
-
24
-
25
-
26
-
27
-
28
-
29
-
30
-
31
-
32
-
33
-
34
-
35
-
36
-
37
-
38
-
39
-
40
-
41
-
42
-
43
-
44
-
45
-
46
-
47
-
48
-
49
-
50
-
51
-
52
-
53
-
54
-
55
-
56
-
57
-
58
-
59
-
60
-
61
-
62
-
63
-
64
-
65
-
66
-
67
-
68
-
69
-
70
-
71
-
72
-
73
-
74
-
75
-
76
-
77
-
78
-
79
-
80
-
81
-
82
-
83
-
84
-
85
-
86
-
87
-
88
-
89
-
90
-
91
-
92
-
93
-
94
-
95
-
96
-
97
-
98
-
99
-
100
-
101
-
102
-
103
-
104
-
105
-
106
-
107
-
108
-
109
-
110
-
111
-
112
-
113
-
114
-
115
-
116
-
117
-
118
-
119
-
120
-
121
-
122
-
123
-
124
-
125
-
126
-
127
-
128
-
129
-
130
-
131
-
132
-
133
-
134
-
135
-
136
-
137
-
138
-
139
-
140
-
141
-
142
-
143
-
144
-
145
-
146
-
147
-
148
-
149
-
150
-
151
-
152
-
153
-
154
-
155
-
156
-
157
-
158
-
159
-
160
-
161
-
162
-
163
-
164
-
165
-
166
-
167
-
168
-
169
-
170
-
171
-
172
-
173
-
174
-
175
-
176
-
177
-
178
-
179
-
180
-
181
-
182
-
183
-
184
-
185
-
186
-
187
-
188
-
189
-
190
-
191
-
192
-
193
-
194
-
195
-
196
-
197
-
198
-
199
-
200
-
201
-
202
-
203
-
204
-
205
-
206
-
207
-
208
-
209
-
210
-
211
-
212
-
213
-
214
-
215
-
216
-
217
-
218
-
219
-
220
-
221
-
222
-
223
-
224
-
225
-
226
-
227
-
228
-
229
-
230
-
231
-
232
-
233
-
234
-
235
-
236
-
237
-
238
-
239
-
240
-
241
-
242
-
243
-
244
-
245
-
246
-
247
-
248
-
249
-
250
-
251
-
252
-
253
-
254
-
255
-
256
-
257
-
258
-
259
-
260
-
261
-
262
-
263
-
264
-
265
-
266
-
267
-
268
-
269
-
270
-
271
-
272
-
273
-
274
-
275
-
276
-
277
-
278
-
279
-
280
-
281
-
282
-
283
-
284
-
285
-
286
-
287
-
288
-
289
-
290
-
291
-
292
-
293
-
294
-
295
-
296
-
297
-
298
-
299
-
300
-
301
-
302
-
303
-
304
-
305
-
306
-
307
-
308
-
309
-
310
-
311
-
312
-
313
-
314
-
315
-
316
-
317
-
318
-
319
-
320
-
321
-
322
-
323
-
324
-
325
-
326
-
327
-
328
-
329
-
330
-
331
-
332
-
333
-
334
-
335
-
336
-
337
-
338
-
339
-
340
-
341
-
342
-
343
-
344
-
345
-
346
-
347
-
348
-
349
-
350
-
351
-
352
-
353
-
354
-
355
-
356
-
357
-
358
-
359
-
360
-
361
-
362
-
363
-
364
-
365
-
366
-
367
-
 368
368 -
 369
369 -
 370
370 -
 371
371 -
 372
372 -
 373
373 -
 374
374 -
 375
375 -
 376
376 -
 377
377 -
 378
378 -
 379
379 -
 380
380 -
 381
381 -
 382
382 -
 383
383 -
 384
384 -
 385
385 -
 386
386 -
 387
387 -
 388
388 -
389
-
390
-
391
-
392
-
393
-
394
-
395
-
396
-
397
-
398
-
399
-
400
-
401
-
402
 |
 |
377
Auditors’ Reports
Motions for AGM
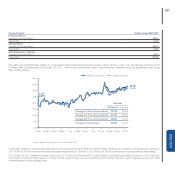
Discount Analysis Simple Average 2001-2010
Preference Shares
Discount vs. Ordinary Shares 30.8%
Implied Ratio 0.692
Savings Shares
Discount vs. Ordinary Shares 28.2%
Implied Ratio 0.718
Delta Preference vs. Savings
Discount vs. Ordinary Shares 2.5%
Implied Ratio (0.025)
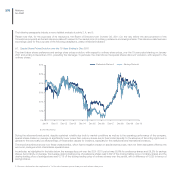
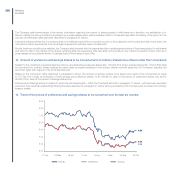
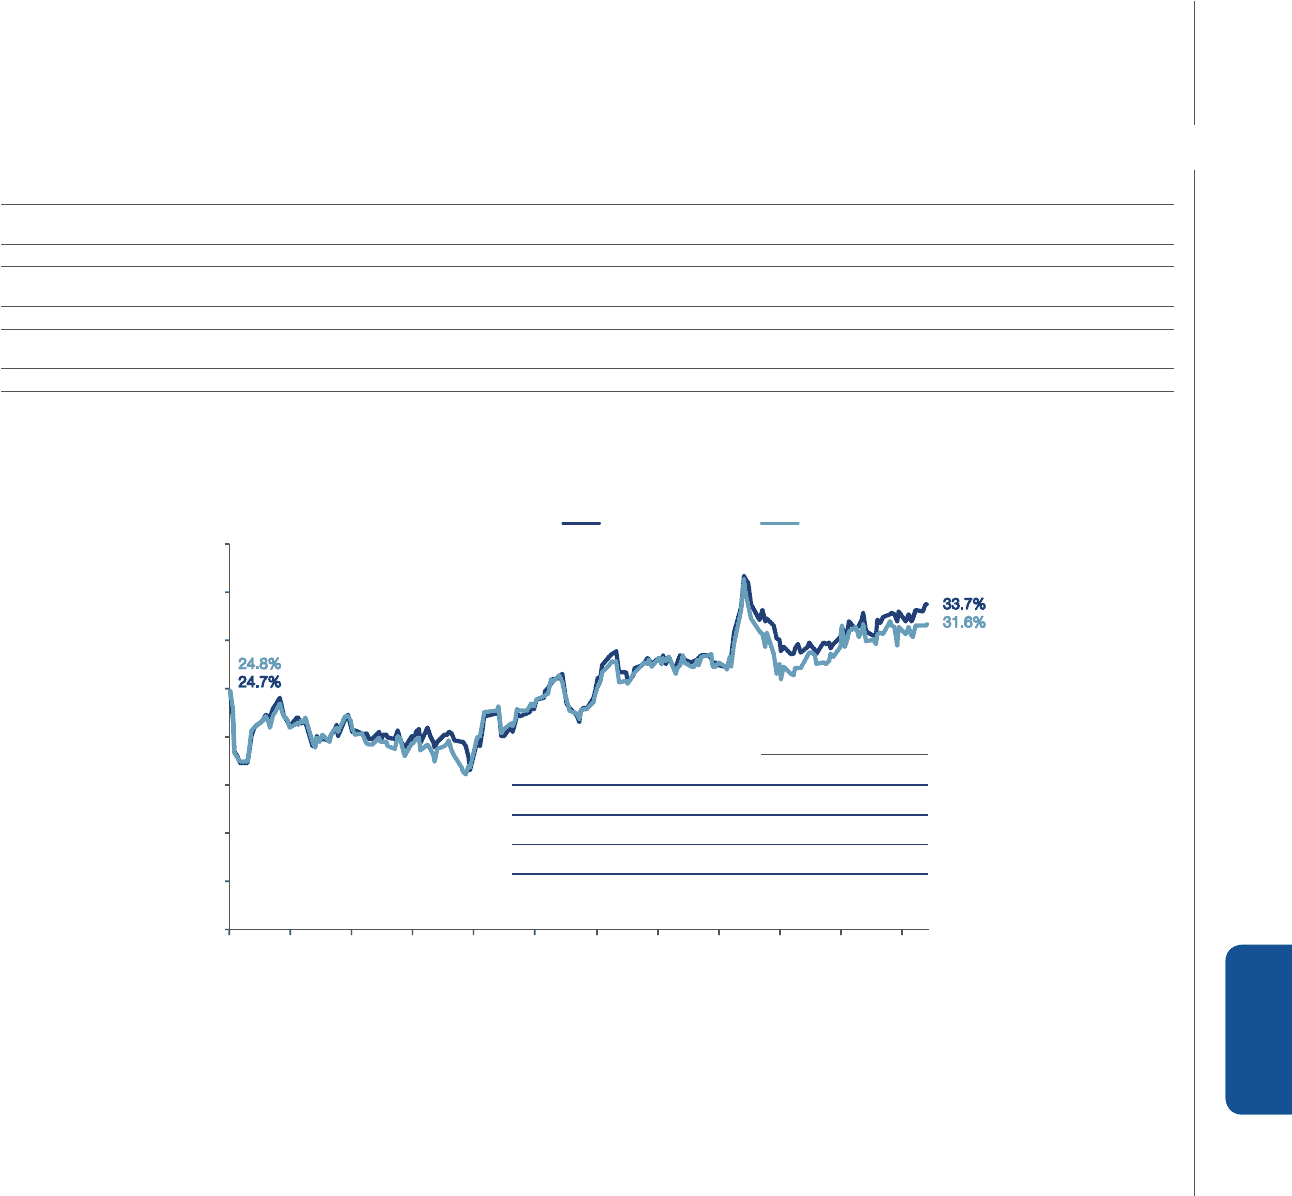
The pattern is confirmed when taking into consideration Fiat special shares discount evolution since January 3, 2011 (i.e., the first day of trading of the
Company after the Demerger) until October 26, 2011. Over the above mentioned period, special shares constantly traded at significantly lower prices
than ordinary shares.
3 Jan 29 Jan 24 Feb 22 Mar 17 Apr 13 May 8 Jun 4 Jul 30 Jul 25 Aug 20 Sep 16 Oct
Preference Discount Savings Discount
40%
35%
30%
25%
20%
15%
10%
5%
0%
Discount
Preference Savings
Average 1m Prior-Announcement 32.3% 30.9%
Average 3m Prior-Announcement 31.0% 29.6%
Average 6m Prior-Announcement 28.3% 27.5%
Average since Demerger 25.3% 24.7%
Source: Bloomberg; share prices as of 26-October-2011
In particular, preference and savings shares had a worse market performance than the ordinary shares, leading to an increase in the discount from January 3
(24.7% and 24.8% for preference and savings shares respectively) to October 26 (33.7% and 31.6% for preference and savings shares respectively).
On October 26, 2011 preference shares closed at a 33.7% discount with respect to ordinary shares, whilst savings shares closed at a 31.6% discount.
The implied conversion ratios based on closing market prices on that day were therefore 0.663 ordinary shares for each preference share and 0.684
ordinary shares for each savings share.