Chrysler 2011 Annual Report Download - page 102
Download and view the complete annual report
Please find page 102 of the 2011 Chrysler annual report below. You can navigate through the pages in the report by either clicking on the pages listed below, or by using the keyword search tool below to find specific information within the annual report.-
 1
1 -
2
-
3
-
4
-
5
-
6
-
7
-
8
-
9
-
10
-
11
-
12
-
13
-
14
-
15
-
16
-
17
-
18
-
19
-
20
-
21
-
22
-
23
-
24
-
25
-
26
-
27
-
28
-
29
-
30
-
31
-
32
-
33
-
34
-
35
-
36
-
37
-
38
-
39
-
40
-
41
-
42
-
43
-
44
-
45
-
46
-
47
-
48
-
49
-
50
-
51
-
52
-
53
-
54
-
55
-
56
-
57
-
58
-
59
-
60
-
61
-
62
-
63
-
64
-
65
-
66
-
67
-
68
-
69
-
70
-
71
-
72
-
73
-
74
-
75
-
76
-
77
-
78
-
79
-
80
-
81
-
82
-
83
-
84
-
85
-
86
-
87
-
88
-
89
-
90
-
91
-
 92
92 -
 93
93 -
 94
94 -
 95
95 -
 96
96 -
 97
97 -
 98
98 -
 99
99 -
 100
100 -
 101
101 -
 102
102 -
 103
103 -
 104
104 -
 105
105 -
 106
106 -
 107
107 -
 108
108 -
 109
109 -
 110
110 -
 111
111 -
 112
112 -
113
-
114
-
115
-
116
-
117
-
118
-
119
-
120
-
121
-
122
-
123
-
124
-
125
-
126
-
127
-
128
-
129
-
130
-
131
-
132
-
133
-
134
-
135
-
136
-
137
-
138
-
139
-
140
-
141
-
142
-
143
-
144
-
145
-
146
-
147
-
148
-
149
-
150
-
151
-
152
-
153
-
154
-
155
-
156
-
157
-
158
-
159
-
160
-
161
-
162
-
163
-
164
-
165
-
166
-
167
-
168
-
169
-
170
-
171
-
172
-
173
-
174
-
175
-
176
-
177
-
178
-
179
-
180
-
181
-
182
-
183
-
184
-
185
-
186
-
187
-
188
-
189
-
190
-
191
-
192
-
193
-
194
-
195
-
196
-
197
-
198
-
199
-
200
-
201
-
202
-
203
-
204
-
205
-
206
-
207
-
208
-
209
-
210
-
211
-
212
-
213
-
214
-
215
-
216
-
217
-
218
-
219
-
220
-
221
-
222
-
223
-
224
-
225
-
226
-
227
-
228
-
229
-
230
-
231
-
232
-
233
-
234
-
235
-
236
-
237
-
238
-
239
-
240
-
241
-
242
-
243
-
244
-
245
-
246
-
247
-
248
-
249
-
250
-
251
-
252
-
253
-
254
-
255
-
256
-
257
-
258
-
259
-
260
-
261
-
262
-
263
-
264
-
265
-
266
-
267
-
268
-
269
-
270
-
271
-
272
-
273
-
274
-
275
-
276
-
277
-
278
-
279
-
280
-
281
-
282
-
283
-
284
-
285
-
286
-
287
-
288
-
289
-
290
-
291
-
292
-
293
-
294
-
295
-
296
-
297
-
298
-
299
-
300
-
301
-
302
-
303
-
304
-
305
-
306
-
307
-
308
-
309
-
310
-
311
-
312
-
313
-
314
-
315
-
316
-
317
-
318
-
319
-
320
-
321
-
322
-
323
-
324
-
325
-
326
-
327
-
328
-
329
-
330
-
331
-
332
-
333
-
334
-
335
-
336
-
337
-
338
-
339
-
340
-
341
-
342
-
343
-
344
-
345
-
346
-
347
-
348
-
349
-
350
-
351
-
352
-
353
-
354
-
355
-
356
-
357
-
358
-
359
-
360
-
361
-
362
-
363
-
364
-
365
-
366
-
367
-
368
-
369
-
370
-
371
-
372
-
373
-
374
-
375
-
376
-
377
-
378
-
379
-
380
-
381
-
382
-
383
-
384
-
385
-
386
-
387
-
388
-
389
-
390
-
391
-
392
-
393
-
394
-
395
-
396
-
397
-
398
-
399
-
400
-
401
-
402
 |
 |
101
Report on Operations
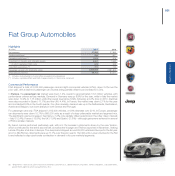
Fiat Group Automobiles
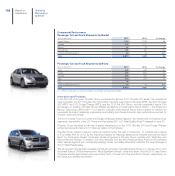
Highlights
(€ million) 2011 2010
Net revenues 27,980 27,860
Trading profit/(loss) 430 607
Operating profit/(loss) (*) 1,876 515
Investments in tangible and intangible assets 2,367 1,652
of which capitalized R&D costs 642 529
Total R&D expenditure (**) 771 722
Passenger car and LCV shipments (units) 2,032,900 2,081,800
Employees at year end 59,714 57,611
(*) Includes restructuring costs and other unusual income/(expense)
(**) Includes capitalized R&D and R&D charged directly to the income statement
Commercial Performance
FGA shipped5 a total of 2,032,900 passenger cars and light commercial vehicles (LCVs), down 2.4% over the
prior year, with a decline in passenger car volumes being partially offset by an increase for LCVs.
In Europe, the passenger car market was down 1.4% overall to approximately 13.6 million vehicles, with
performance uneven across markets. Demand in Germany was up 8.8% for the year, while in Italy the market
was down 10.9% to 1.75 million units (the lowest level since 1996), following a 9.2% drop in 2010. Declines
were also recorded in Spain (-17.7%) and the UK (-4.4%). In France, the market was down 2.1% for the year
and contracted 8.6% in the fourth quarter. For other markets, demand was up in the Netherlands, Switzerland,
Austria and Belgium, but down sharply in both Greece and Portugal.
For passenger cars only, FGA shipped 1,612,900 vehicles, a 4.6% decrease over 2010. In Europe, passenger
car shipments were down 10.7% to 860,000 units as a result of a less unfavorable market and segment mix.
The significant volume increase in Germany (+7.2%) only partially offset reductions in the other major markets
– Italy (-12.4%), France (-15.8%), the UK (-1.9%) and Spain (-21.6%) – although gains were achieved in several
of FGA’s smaller markets.
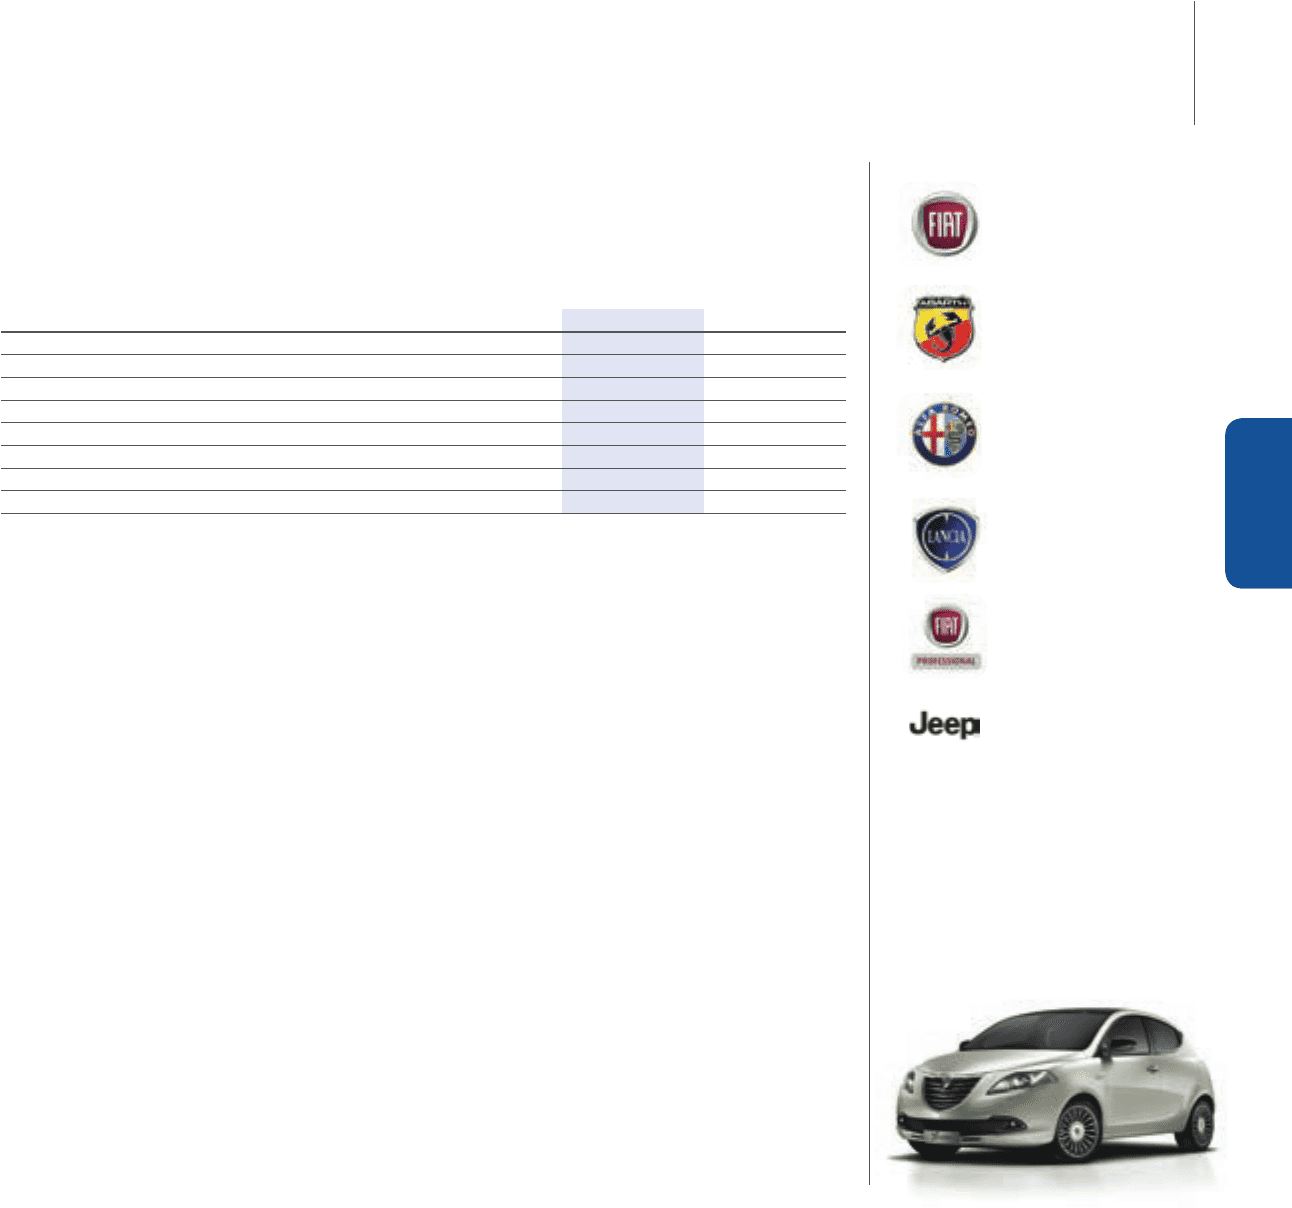
By brand, Lancia performed particularly well, with a 9.1% increase in shipments driven by the new Ypsilon,
which contributed for the entire second half, as well as the Voyager and Thema, launched in November, making
Lancia-Chrysler a full-liner in Europe. The Jeep brand shipped around 26,000 vehicles in Europe for the full year
and, for Alfa Romeo, shipments were up 17.7% over the prior year to 132,400 units. Lower volumes for the Fiat
brand reflected a disproportionate contraction in demand in its core markets/segments.
(5) “Shipments”: new cars & LCVs invoiced to external customers (i.e., dealer network, importers, rental companies, corporate fleets,
government agencies and local authorities, etc.)
Report on Operations