Chrysler 2011 Annual Report Download - page 177
Download and view the complete annual report
Please find page 177 of the 2011 Chrysler annual report below. You can navigate through the pages in the report by either clicking on the pages listed below, or by using the keyword search tool below to find specific information within the annual report.-
 1
1 -
2
-
3
-
4
-
5
-
6
-
7
-
8
-
9
-
10
-
11
-
12
-
13
-
14
-
15
-
16
-
17
-
18
-
19
-
20
-
21
-
22
-
23
-
24
-
25
-
26
-
27
-
28
-
29
-
30
-
31
-
32
-
33
-
34
-
35
-
36
-
37
-
38
-
39
-
40
-
41
-
42
-
43
-
44
-
45
-
46
-
47
-
48
-
49
-
50
-
51
-
52
-
53
-
54
-
55
-
56
-
57
-
58
-
59
-
60
-
61
-
62
-
63
-
64
-
65
-
66
-
67
-
68
-
69
-
70
-
71
-
72
-
73
-
74
-
75
-
76
-
77
-
78
-
79
-
80
-
81
-
82
-
83
-
84
-
85
-
86
-
87
-
88
-
89
-
90
-
91
-
92
-
93
-
94
-
95
-
96
-
97
-
98
-
99
-
100
-
101
-
102
-
103
-
104
-
105
-
106
-
107
-
108
-
109
-
110
-
111
-
112
-
113
-
114
-
115
-
116
-
117
-
118
-
119
-
120
-
121
-
122
-
123
-
124
-
125
-
126
-
127
-
128
-
129
-
130
-
131
-
132
-
133
-
134
-
135
-
136
-
137
-
138
-
139
-
140
-
141
-
142
-
143
-
144
-
145
-
146
-
147
-
148
-
149
-
150
-
151
-
152
-
153
-
154
-
155
-
156
-
157
-
158
-
159
-
160
-
161
-
162
-
163
-
164
-
165
-
166
-
 167
167 -
 168
168 -
 169
169 -
 170
170 -
 171
171 -
 172
172 -
 173
173 -
 174
174 -
 175
175 -
 176
176 -
 177
177 -
 178
178 -
 179
179 -
 180
180 -
 181
181 -
 182
182 -
 183
183 -
 184
184 -
 185
185 -
 186
186 -
 187
187 -
188
-
189
-
190
-
191
-
192
-
193
-
194
-
195
-
196
-
197
-
198
-
199
-
200
-
201
-
202
-
203
-
204
-
205
-
206
-
207
-
208
-
209
-
210
-
211
-
212
-
213
-
214
-
215
-
216
-
217
-
218
-
219
-
220
-
221
-
222
-
223
-
224
-
225
-
226
-
227
-
228
-
229
-
230
-
231
-
232
-
233
-
234
-
235
-
236
-
237
-
238
-
239
-
240
-
241
-
242
-
243
-
244
-
245
-
246
-
247
-
248
-
249
-
250
-
251
-
252
-
253
-
254
-
255
-
256
-
257
-
258
-
259
-
260
-
261
-
262
-
263
-
264
-
265
-
266
-
267
-
268
-
269
-
270
-
271
-
272
-
273
-
274
-
275
-
276
-
277
-
278
-
279
-
280
-
281
-
282
-
283
-
284
-
285
-
286
-
287
-
288
-
289
-
290
-
291
-
292
-
293
-
294
-
295
-
296
-
297
-
298
-
299
-
300
-
301
-
302
-
303
-
304
-
305
-
306
-
307
-
308
-
309
-
310
-
311
-
312
-
313
-
314
-
315
-
316
-
317
-
318
-
319
-
320
-
321
-
322
-
323
-
324
-
325
-
326
-
327
-
328
-
329
-
330
-
331
-
332
-
333
-
334
-
335
-
336
-
337
-
338
-
339
-
340
-
341
-
342
-
343
-
344
-
345
-
346
-
347
-
348
-
349
-
350
-
351
-
352
-
353
-
354
-
355
-
356
-
357
-
358
-
359
-
360
-
361
-
362
-
363
-
364
-
365
-
366
-
367
-
368
-
369
-
370
-
371
-
372
-
373
-
374
-
375
-
376
-
377
-
378
-
379
-
380
-
381
-
382
-
383
-
384
-
385
-
386
-
387
-
388
-
389
-
390
-
391
-
392
-
393
-
394
-
395
-
396
-
397
-
398
-
399
-
400
-
401
-
402
 |
 |
Consolidated
Financial
Statements
at 31 December
2011
Notes
176
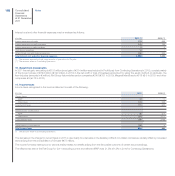
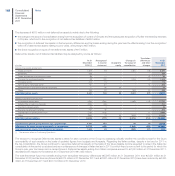
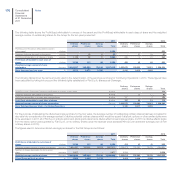
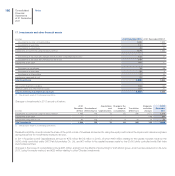
16. Property, plant and equipment
In 2011 and 2010, changes in the gross carrying amount of Property, plant and equipment were as follows:
(€ million)
At 31
December
2010 (*) Additions Divestitures
Change in
the scope of
consolidation
Translation
differences
Other
changes
At 31
December
2011
Land 372 24 (10) 310 21 9 726
Owned industrial buildings 3,803 235 (27) 1,824 87 16 5,938
Industrial buildings leased under finance leases 60 - (2) - - (1) 57
Total Industrial buildings 3,863 235 (29) 1,824 87 15 5,995
Owned plant, machinery and equipment 23,738 1,456 (835) 3,201 (198) 849 28,211
Plant, machinery and equipment leased under finance leases 432 37 (111) - (3) 4 359
Total Plant, machinery and equipment 24,170 1,493 (946) 3,201 (201) 853 28,570
Other tangible assets 1,287 589 (194) 3,146 349 226 5,403
Advances and tangible assets in progress 961 1,584 (72) 1,201 122 (1,117) 2,679
Gross carrying amount 30,653 3,925 (1.251) 9,682 378 (14) 43,373
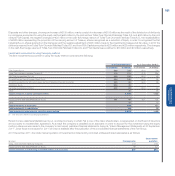
(€ million)
At 31
December
2009 Additions Divestitures
Change in
the scope of
consolidation
Translation
differences
Other
changes
Reclassified
to
Discontinued
Operations
At 31
December
2010 (*)
Land 612 2 (4) - 14 (42) (210) 372
Owned industrial buildings 5,307 99 (12) 14 161 186 (1,952) 3,803
Industrial buildings leased under finance leases 76 - (1) - - 1 (16) 60
Total Industrial buildings 5,383 99 (13) 14 161 187 (1,968) 3,863
Owned plant, machinery and equipment 27,323 1,098 (551) 180 627 781 (5,720) 23,738
Plant, machinery and equipment leased under
finance leases 356 107 - - 1 17 (49) 432
Total Plant, machinery and equipment 27,679 1,205 (551) 180 628 798 (5,769) 24,170
Assets sold with a buy-back commitment 1,218 344 (139) - 6 (262) (1,167) -
Other tangible assets 1,848 224 (195) 9 52 38 (689) 1,287
Advances and tangible assets in progress 1,393 730 (14) 7 50 (1,011) (194) 961
Gross carrying amount 38,133 2,604 (916) 210 911 (292) (9,997) 30,653
(*) The amounts relate to Continuing Operations.