Chrysler 2011 Annual Report Download - page 174
Download and view the complete annual report
Please find page 174 of the 2011 Chrysler annual report below. You can navigate through the pages in the report by either clicking on the pages listed below, or by using the keyword search tool below to find specific information within the annual report.-
 1
1 -
2
-
3
-
4
-
5
-
6
-
7
-
8
-
9
-
10
-
11
-
12
-
13
-
14
-
15
-
16
-
17
-
18
-
19
-
20
-
21
-
22
-
23
-
24
-
25
-
26
-
27
-
28
-
29
-
30
-
31
-
32
-
33
-
34
-
35
-
36
-
37
-
38
-
39
-
40
-
41
-
42
-
43
-
44
-
45
-
46
-
47
-
48
-
49
-
50
-
51
-
52
-
53
-
54
-
55
-
56
-
57
-
58
-
59
-
60
-
61
-
62
-
63
-
64
-
65
-
66
-
67
-
68
-
69
-
70
-
71
-
72
-
73
-
74
-
75
-
76
-
77
-
78
-
79
-
80
-
81
-
82
-
83
-
84
-
85
-
86
-
87
-
88
-
89
-
90
-
91
-
92
-
93
-
94
-
95
-
96
-
97
-
98
-
99
-
100
-
101
-
102
-
103
-
104
-
105
-
106
-
107
-
108
-
109
-
110
-
111
-
112
-
113
-
114
-
115
-
116
-
117
-
118
-
119
-
120
-
121
-
122
-
123
-
124
-
125
-
126
-
127
-
128
-
129
-
130
-
131
-
132
-
133
-
134
-
135
-
136
-
137
-
138
-
139
-
140
-
141
-
142
-
143
-
144
-
145
-
146
-
147
-
148
-
149
-
150
-
151
-
152
-
153
-
154
-
155
-
156
-
157
-
158
-
159
-
160
-
161
-
162
-
163
-
 164
164 -
 165
165 -
 166
166 -
 167
167 -
 168
168 -
 169
169 -
 170
170 -
 171
171 -
 172
172 -
 173
173 -
 174
174 -
 175
175 -
 176
176 -
 177
177 -
 178
178 -
 179
179 -
 180
180 -
 181
181 -
 182
182 -
 183
183 -
 184
184 -
185
-
186
-
187
-
188
-
189
-
190
-
191
-
192
-
193
-
194
-
195
-
196
-
197
-
198
-
199
-
200
-
201
-
202
-
203
-
204
-
205
-
206
-
207
-
208
-
209
-
210
-
211
-
212
-
213
-
214
-
215
-
216
-
217
-
218
-
219
-
220
-
221
-
222
-
223
-
224
-
225
-
226
-
227
-
228
-
229
-
230
-
231
-
232
-
233
-
234
-
235
-
236
-
237
-
238
-
239
-
240
-
241
-
242
-
243
-
244
-
245
-
246
-
247
-
248
-
249
-
250
-
251
-
252
-
253
-
254
-
255
-
256
-
257
-
258
-
259
-
260
-
261
-
262
-
263
-
264
-
265
-
266
-
267
-
268
-
269
-
270
-
271
-
272
-
273
-
274
-
275
-
276
-
277
-
278
-
279
-
280
-
281
-
282
-
283
-
284
-
285
-
286
-
287
-
288
-
289
-
290
-
291
-
292
-
293
-
294
-
295
-
296
-
297
-
298
-
299
-
300
-
301
-
302
-
303
-
304
-
305
-
306
-
307
-
308
-
309
-
310
-
311
-
312
-
313
-
314
-
315
-
316
-
317
-
318
-
319
-
320
-
321
-
322
-
323
-
324
-
325
-
326
-
327
-
328
-
329
-
330
-
331
-
332
-
333
-
334
-
335
-
336
-
337
-
338
-
339
-
340
-
341
-
342
-
343
-
344
-
345
-
346
-
347
-
348
-
349
-
350
-
351
-
352
-
353
-
354
-
355
-
356
-
357
-
358
-
359
-
360
-
361
-
362
-
363
-
364
-
365
-
366
-
367
-
368
-
369
-
370
-
371
-
372
-
373
-
374
-
375
-
376
-
377
-
378
-
379
-
380
-
381
-
382
-
383
-
384
-
385
-
386
-
387
-
388
-
389
-
390
-
391
-
392
-
393
-
394
-
395
-
396
-
397
-
398
-
399
-
400
-
401
-
402
 |
 |
173
Consolidated
Financial Statements
at 31 December 2011
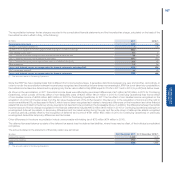
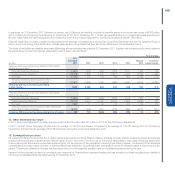
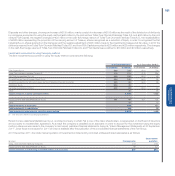
For the Ferrari sector, the cash-generating unit corresponds to the sector as a whole and the expected future cash flows are the operating cash flows taken
from the estimates included in the 2012 budget and the forecast for business performance, made in a prudent manner, taking account of the uncertainties
of the global financial and economic situation, extrapolated for subsequent years by using the specific medium/long-term growth rate for the sector equal
to 2%. These cash flows were then discounted using a post-tax discount rate of 8.7%. The recoverable amount of the cash-generating unit to which the
Ferrari sector goodwill relates is significantly higher than its carrying amount; in addition, the exclusivity of the business, its historical profitability and its
future earnings prospects indicate that this carrying amount will continue to be recoverable, even in the event of difficult economic and market conditions.
Finally, given that impairment indicators existed during the year, the Group tested the recoverability of the net carrying amount of certain goodwill allocated
to the Pico, System, and Comau Mexico cash-generating units of the Comau sector and other minor cash-generating units of the Magneti Marelli, Fiat
Group Automobiles and Metallurgical Products sectors. The recoverable amount was estimated by calculating their value in use, meaning the present value
of an estimate of future cash flows based on operating cash flows derived from the respective 2010-2014 strategic plans, suitably revised by management
to take account of expected developments and also the integration of Fiat with Chrysler, extrapolated to subsequent years and discounted using a rate
substantially aligned with that used at 31 December 2010, which took into consideration the specific risk of the individual cash-generating units. These
revised economic valuations and estimates led to the write-down of goodwill by €224 million, fully recognised in the income statement in 2011 under Other
unusual income (expenses). The impairment loss recognised related to the Comau sector for €130 million, to the Magneti Marelli sector for €69 million and
to the Fiat Group Automobiles sector for €17 million. In the Magneti Marelli and Teksid sectors the same impairment testing led to the write-down of assets
included in Property, plant and equipment (see Note 16).
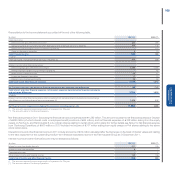
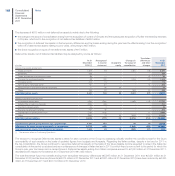
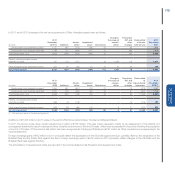
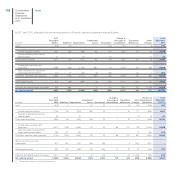
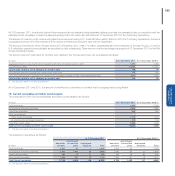
15. Other Intangible assets
In 2011 and 2010, changes in the gross carrying amount of Other intangible assets were as follows:
(€ million)
At 31
December
2010 (*) Additions Divestitures
Changes in
the scope of
consolidation
Translation
differences
and other
changes
Reclassified
to Assets
held for sale
At 31
December
2011
Development costs externally acquired 3,116 681 (2) - 46 - 3,841
Development costs internally generated 3,507 757 (12) - (136) - 4,116
Total Development costs 6,623 1,438 (14) - (90) - 7,957
Patents, concessions and licenses externally acquired 742 115 (35) 1,026 134 - 1,982
Other intangible assets externally acquired 583 50 (10) (1) (16) - 606
Gross carrying amount 7,948 1,603 (59) 1,025 28 - 10,545
(*) The amounts relate to Continuing Operations.
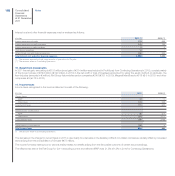
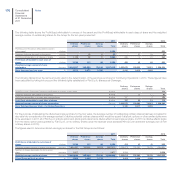
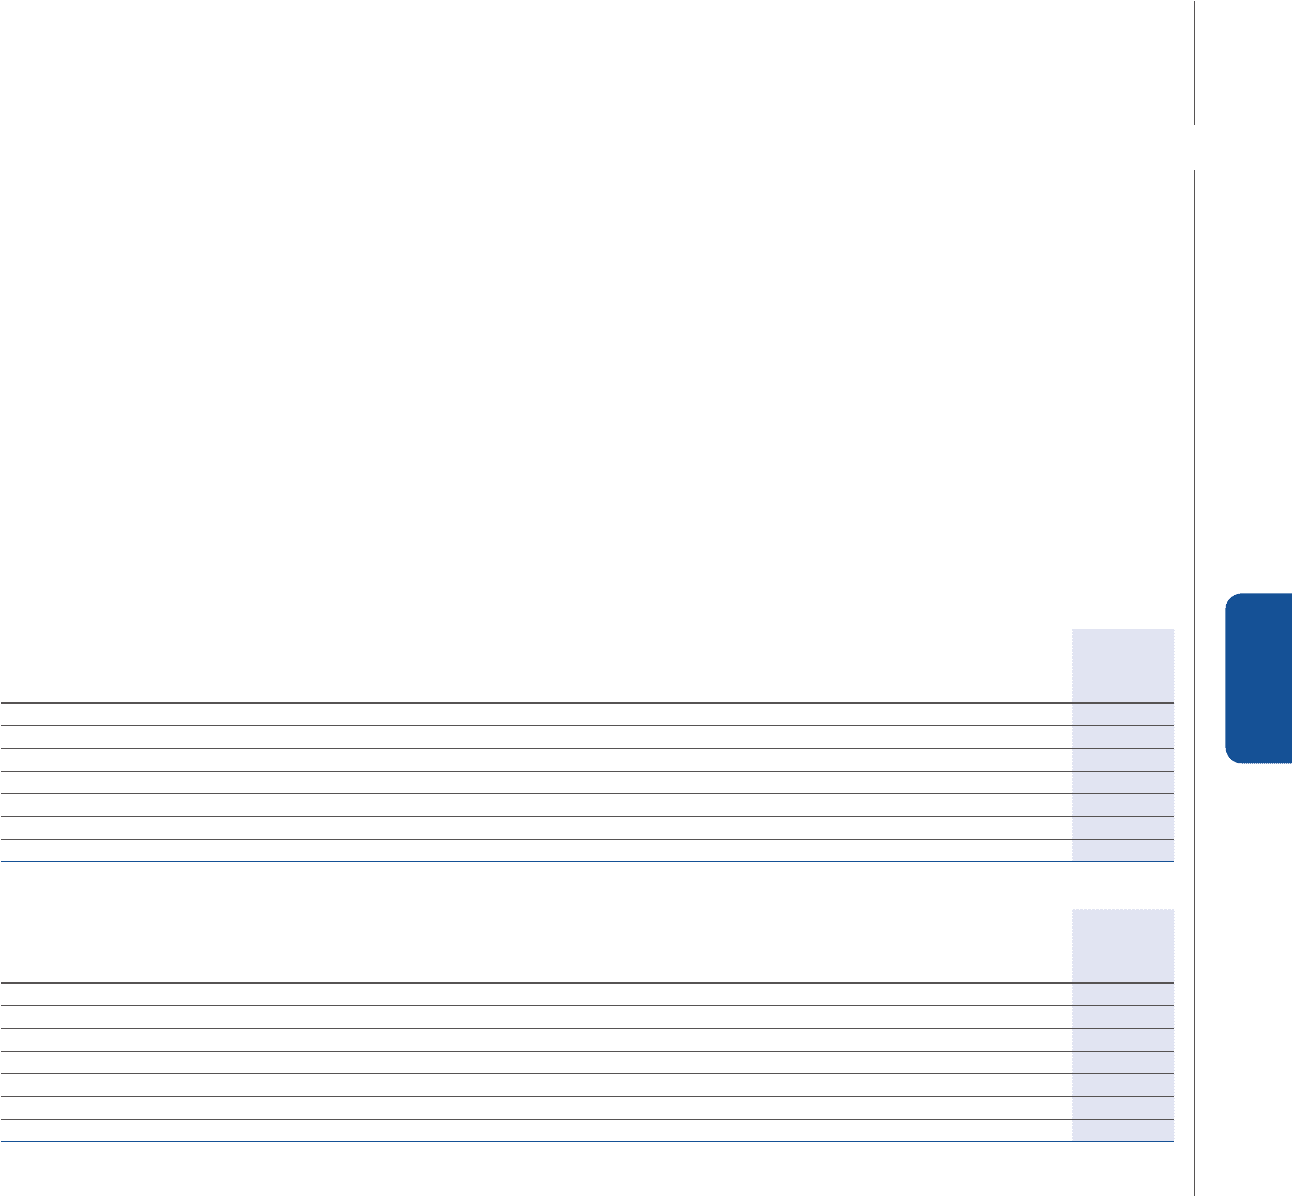
(€ million)
At 31
December
2009 Additions Divestitures
Changes in
the scope of
consolidation
Translation
differences
and other
changes
Reclassified
to
Discontinued
Operations
At 31
December
2010 (*)
Development costs externally acquired 3,343 357 (20) - 18 (582) 3,116
Development costs internally generated 4,504 925 (8) - 112 (2,026) 3,507
Total Development costs 7,847 1,282 (28) - 130 (2,608) 6,623
Patents, concessions and licenses externally acquired 1,276 78 (3) 2 27 (638) 742
Other intangible assets externally acquired 921 98 (48) 3 39 (430) 583
Gross carrying amount 10,044 1,458 (79) 5 196 (3,676) 7,948
(*) The amounts relate to Continuing Operations.