Chrysler 2011 Annual Report Download - page 76
Download and view the complete annual report
Please find page 76 of the 2011 Chrysler annual report below. You can navigate through the pages in the report by either clicking on the pages listed below, or by using the keyword search tool below to find specific information within the annual report.-
 1
1 -
2
-
3
-
4
-
5
-
6
-
7
-
8
-
9
-
10
-
11
-
12
-
13
-
14
-
15
-
16
-
17
-
18
-
19
-
20
-
21
-
22
-
23
-
24
-
25
-
26
-
27
-
28
-
29
-
30
-
31
-
32
-
33
-
34
-
35
-
36
-
37
-
38
-
39
-
40
-
41
-
42
-
43
-
44
-
45
-
46
-
47
-
48
-
49
-
50
-
51
-
52
-
53
-
54
-
55
-
56
-
57
-
58
-
59
-
60
-
61
-
62
-
63
-
64
-
65
-
 66
66 -
 67
67 -
 68
68 -
 69
69 -
 70
70 -
 71
71 -
 72
72 -
 73
73 -
 74
74 -
 75
75 -
 76
76 -
 77
77 -
 78
78 -
 79
79 -
 80
80 -
 81
81 -
 82
82 -
 83
83 -
 84
84 -
 85
85 -
 86
86 -
87
-
88
-
89
-
90
-
91
-
92
-
93
-
94
-
95
-
96
-
97
-
98
-
99
-
100
-
101
-
102
-
103
-
104
-
105
-
106
-
107
-
108
-
109
-
110
-
111
-
112
-
113
-
114
-
115
-
116
-
117
-
118
-
119
-
120
-
121
-
122
-
123
-
124
-
125
-
126
-
127
-
128
-
129
-
130
-
131
-
132
-
133
-
134
-
135
-
136
-
137
-
138
-
139
-
140
-
141
-
142
-
143
-
144
-
145
-
146
-
147
-
148
-
149
-
150
-
151
-
152
-
153
-
154
-
155
-
156
-
157
-
158
-
159
-
160
-
161
-
162
-
163
-
164
-
165
-
166
-
167
-
168
-
169
-
170
-
171
-
172
-
173
-
174
-
175
-
176
-
177
-
178
-
179
-
180
-
181
-
182
-
183
-
184
-
185
-
186
-
187
-
188
-
189
-
190
-
191
-
192
-
193
-
194
-
195
-
196
-
197
-
198
-
199
-
200
-
201
-
202
-
203
-
204
-
205
-
206
-
207
-
208
-
209
-
210
-
211
-
212
-
213
-
214
-
215
-
216
-
217
-
218
-
219
-
220
-
221
-
222
-
223
-
224
-
225
-
226
-
227
-
228
-
229
-
230
-
231
-
232
-
233
-
234
-
235
-
236
-
237
-
238
-
239
-
240
-
241
-
242
-
243
-
244
-
245
-
246
-
247
-
248
-
249
-
250
-
251
-
252
-
253
-
254
-
255
-
256
-
257
-
258
-
259
-
260
-
261
-
262
-
263
-
264
-
265
-
266
-
267
-
268
-
269
-
270
-
271
-
272
-
273
-
274
-
275
-
276
-
277
-
278
-
279
-
280
-
281
-
282
-
283
-
284
-
285
-
286
-
287
-
288
-
289
-
290
-
291
-
292
-
293
-
294
-
295
-
296
-
297
-
298
-
299
-
300
-
301
-
302
-
303
-
304
-
305
-
306
-
307
-
308
-
309
-
310
-
311
-
312
-
313
-
314
-
315
-
316
-
317
-
318
-
319
-
320
-
321
-
322
-
323
-
324
-
325
-
326
-
327
-
328
-
329
-
330
-
331
-
332
-
333
-
334
-
335
-
336
-
337
-
338
-
339
-
340
-
341
-
342
-
343
-
344
-
345
-
346
-
347
-
348
-
349
-
350
-
351
-
352
-
353
-
354
-
355
-
356
-
357
-
358
-
359
-
360
-
361
-
362
-
363
-
364
-
365
-
366
-
367
-
368
-
369
-
370
-
371
-
372
-
373
-
374
-
375
-
376
-
377
-
378
-
379
-
380
-
381
-
382
-
383
-
384
-
385
-
386
-
387
-
388
-
389
-
390
-
391
-
392
-
393
-
394
-
395
-
396
-
397
-
398
-
399
-
400
-
401
-
402
 |
 |

75
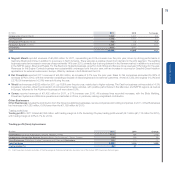
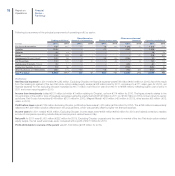
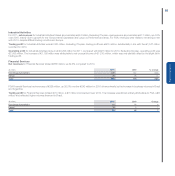
(€ million) 2011 2010 % change
Components (Magneti Marelli) 5,860 5,402 8.5
Fiat Powertrain 4,450 4,211 5.7
Metallurgical Products (Teksid) 922 776 18.8
Production Systems (Comau) 1,402 1,023 37.0
Eliminations (669) (547) -
Total 11,965 10,865 10.1
Magneti Marelli reported revenues of €5,860 million for 2011, representing an 8.5% increase over the prior year, driven by strong performance in
Germany, Brazil and China, in addition to a recovery in North America. There was also a positive impact from demand in the LCV segment. The Lighting
business posted an increase in revenues of approximately 14% over 2010, primarily due to strong demand in the German market, in addition to a recovery
in the NAFTA region, Brazil and Russia. For the Electronic Systems business, growth in both China and Europe drove revenues 16% higher for the year.
Revenues for the Engine Controls business were substantially unchanged over the prior year, with an increase in volumes for Gasoline Direct Injection
applications for external customers in Europe, offset by declines in both Brazil and the U.S.
Fiat Powertrain reported 2011 revenues of €4,450 million, an increase of 5.7% over the prior year. Sales to Fiat companies accounted for 86% of
revenues (87% in 2010), with the remainder consisting principally of diesel engines sold to external customers. A total of 2,352,000 engines (+0.2%) and
2,278,000 transmissions (+2.0%) were sold during the year.
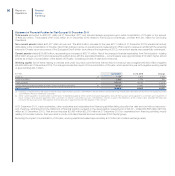
Teksid had revenues of €922 million for 2011, up 18.8% over the prior year, mainly due to higher volumes. The Cast Iron business unit recorded a 14.3%
increase in volumes, driven by production of components for heavy vehicles, with positive performance in the Mercosur and NAFTA regions, as well as
in Europe. Volumes for the Aluminum business unit were down 8.0%.
Comau reported revenues of €1,402 million for 2011, a 37% increase over 2010. All business lines recorded increases, with the Body Welding,
Powertrain Systems and Robotics operations and activities in China, in particular, making a significant contribution.
Other Businesses
Other Businesses includes the contribution from the Group’s publishing businesses, service companies and holding companies. In 2011, Other Businesses
had revenues of €1,083 million, 6.6% lower than the €1,159 million for 2010.
Trading profit/(loss)
Trading profit for 2011 totaled €2,392 million, with trading margin at 4.0%. Excluding Chrysler, trading profit was €1,047 million (€1,112 million for 2010),
with trading margin at 2.8% (3.1% for 2010).
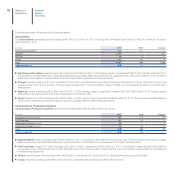
Trading profit/(loss) by business
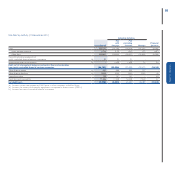
(€ million) 2011 2010 Change
Automobiles (Fiat Group Automobiles, Chrysler, Maserati, Ferrari) 2,127 934 1,193
Components & Production Systems (Magneti Marelli, Fiat Powertrain(1), Teksid, Comau) 348 249 99
Other Businesses (Publishing, Holding Companies and Other) and Eliminations (83) (71) -12
Total Fiat Group 2,392 1,112 1,280
Trading margin (%) 4.0 3.1
(1) Fiat Powertrain includes activities of the Passenger & Commercial Vehicles business line of the former FPT Powertrain Technologies
Report on Operations