Chrysler 2011 Annual Report Download - page 165
Download and view the complete annual report
Please find page 165 of the 2011 Chrysler annual report below. You can navigate through the pages in the report by either clicking on the pages listed below, or by using the keyword search tool below to find specific information within the annual report.-
 1
1 -
2
-
3
-
4
-
5
-
6
-
7
-
8
-
9
-
10
-
11
-
12
-
13
-
14
-
15
-
16
-
17
-
18
-
19
-
20
-
21
-
22
-
23
-
24
-
25
-
26
-
27
-
28
-
29
-
30
-
31
-
32
-
33
-
34
-
35
-
36
-
37
-
38
-
39
-
40
-
41
-
42
-
43
-
44
-
45
-
46
-
47
-
48
-
49
-
50
-
51
-
52
-
53
-
54
-
55
-
56
-
57
-
58
-
59
-
60
-
61
-
62
-
63
-
64
-
65
-
66
-
67
-
68
-
69
-
70
-
71
-
72
-
73
-
74
-
75
-
76
-
77
-
78
-
79
-
80
-
81
-
82
-
83
-
84
-
85
-
86
-
87
-
88
-
89
-
90
-
91
-
92
-
93
-
94
-
95
-
96
-
97
-
98
-
99
-
100
-
101
-
102
-
103
-
104
-
105
-
106
-
107
-
108
-
109
-
110
-
111
-
112
-
113
-
114
-
115
-
116
-
117
-
118
-
119
-
120
-
121
-
122
-
123
-
124
-
125
-
126
-
127
-
128
-
129
-
130
-
131
-
132
-
133
-
134
-
135
-
136
-
137
-
138
-
139
-
140
-
141
-
142
-
143
-
144
-
145
-
146
-
147
-
148
-
149
-
150
-
151
-
152
-
153
-
154
-
 155
155 -
 156
156 -
 157
157 -
 158
158 -
 159
159 -
 160
160 -
 161
161 -
 162
162 -
 163
163 -
 164
164 -
 165
165 -
 166
166 -
 167
167 -
 168
168 -
 169
169 -
 170
170 -
 171
171 -
 172
172 -
 173
173 -
 174
174 -
 175
175 -
176
-
177
-
178
-
179
-
180
-
181
-
182
-
183
-
184
-
185
-
186
-
187
-
188
-
189
-
190
-
191
-
192
-
193
-
194
-
195
-
196
-
197
-
198
-
199
-
200
-
201
-
202
-
203
-
204
-
205
-
206
-
207
-
208
-
209
-
210
-
211
-
212
-
213
-
214
-
215
-
216
-
217
-
218
-
219
-
220
-
221
-
222
-
223
-
224
-
225
-
226
-
227
-
228
-
229
-
230
-
231
-
232
-
233
-
234
-
235
-
236
-
237
-
238
-
239
-
240
-
241
-
242
-
243
-
244
-
245
-
246
-
247
-
248
-
249
-
250
-
251
-
252
-
253
-
254
-
255
-
256
-
257
-
258
-
259
-
260
-
261
-
262
-
263
-
264
-
265
-
266
-
267
-
268
-
269
-
270
-
271
-
272
-
273
-
274
-
275
-
276
-
277
-
278
-
279
-
280
-
281
-
282
-
283
-
284
-
285
-
286
-
287
-
288
-
289
-
290
-
291
-
292
-
293
-
294
-
295
-
296
-
297
-
298
-
299
-
300
-
301
-
302
-
303
-
304
-
305
-
306
-
307
-
308
-
309
-
310
-
311
-
312
-
313
-
314
-
315
-
316
-
317
-
318
-
319
-
320
-
321
-
322
-
323
-
324
-
325
-
326
-
327
-
328
-
329
-
330
-
331
-
332
-
333
-
334
-
335
-
336
-
337
-
338
-
339
-
340
-
341
-
342
-
343
-
344
-
345
-
346
-
347
-
348
-
349
-
350
-
351
-
352
-
353
-
354
-
355
-
356
-
357
-
358
-
359
-
360
-
361
-
362
-
363
-
364
-
365
-
366
-
367
-
368
-
369
-
370
-
371
-
372
-
373
-
374
-
375
-
376
-
377
-
378
-
379
-
380
-
381
-
382
-
383
-
384
-
385
-
386
-
387
-
388
-
389
-
390
-
391
-
392
-
393
-
394
-
395
-
396
-
397
-
398
-
399
-
400
-
401
-
402
 |
 |

Consolidated
Financial
Statements
at 31 December
2011
Notes
164
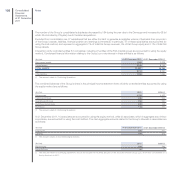
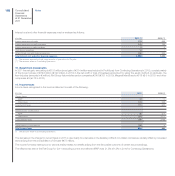
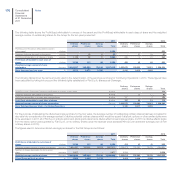
5. Other income (expenses)
This item consists of income arising from trading operations which is not attributable to the sale of goods and services, net of miscellaneous operating costs
which cannot be allocated to specific functional areas, such as indirect taxes and duties, and accruals for various provisions not attributable to other items
of Cost of sales or Selling, general and administrative costs.
6. Gains (losses) on the disposal of investments
Gains (losses) on the disposal of investments amount to a net gain of €21 million in 2011 and include, among others, the gain of €8 million arising from the
disposal of the investment in Fiat Switzerland to the Fiat Industrial group. In 2010 gains on the disposal of investments for Continuing Operations amounted
to €12 million and consisted mainly of the gain of €10 million arising from the acquisition of the remaining 50% of the joint venture Fiat GM Powertrain
Polska.
7. Restructuring costs
Restructuring costs in 2011 amount to €102 million (€118 million in 2010) and mainly relate to the Fiat Group Automobiles sector for €78 million (€90 million
in 2010) and Magneti Marelli sector for €16 million (€26 million in 2010).
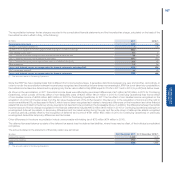
8. Other unusual income (expenses)
Other unusual income amounts to €2,100 million in 2011. Of this, €1,729 million relates to the gain resulting from the measurement at fair value of the
investment of 30% in Chrysler held before the acquisition of control and €288 million to the valuation of the right to receive an additional ownership interest
of 5% following the occurrence of the Ecological Event, as discussed in the Section – Investment in Chrysler. In 2011, Other unusual income also includes
a gain of €69 million on Other post-employment benefits arising from a plan amendment associated with a Chrysler legal services plan which will terminate
in 2013.
Other unusual expenses, amounting to €1,075 million in 2011, includes €220 million relating to the revaluation of the inventories of Chrysler on initial
consolidation as the consequence of measuring the identifiable assets acquired and identifiable liabilities assumed at fair value, this item was recognised
as an expense in the income statement in June as a result of the rapid turnover of inventories. The amount of €855 million arising from the other sectors
(mainly Fiat Group Automobiles) is principally the result of the process for the strategic realignment of the manufacturing and commercial activities of Fiat
with those of Chrysler, which accelerated further following the acquisition of control, as well as the realignment of certain minor activities. Write-downs in
the above-mentioned amount, which arise from the updating of the economic valuations and estimates made during the year, consist of the write-down of
goodwill by €224 million and of development costs by €161 million as discussed in further detail in Note 15, and the write-down of certain other assets of
€302 million as discussed in Note 16.
In 2010 Other unusual expenses included in Profit (loss) from Continuing Operations amounted to €14 million.
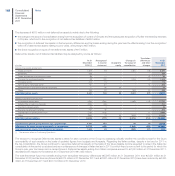
9. Financial income (expenses)
In addition to the items included in the specific lines of the income statement, Net financial income (expenses) in 2011 also includes the Interest income
from customers and other financial income of financial services companies included in Net revenues for €235 million (€186 million in 2010 for Continuing
Operations) and Interest cost and other financial charges from financial services companies included in Cost of sales for €148 million (€107 million in 2010
for Continuing Operations).