Chrysler 2011 Annual Report Download - page 209
Download and view the complete annual report
Please find page 209 of the 2011 Chrysler annual report below. You can navigate through the pages in the report by either clicking on the pages listed below, or by using the keyword search tool below to find specific information within the annual report.-
 1
1 -
2
-
3
-
4
-
5
-
6
-
7
-
8
-
9
-
10
-
11
-
12
-
13
-
14
-
15
-
16
-
17
-
18
-
19
-
20
-
21
-
22
-
23
-
24
-
25
-
26
-
27
-
28
-
29
-
30
-
31
-
32
-
33
-
34
-
35
-
36
-
37
-
38
-
39
-
40
-
41
-
42
-
43
-
44
-
45
-
46
-
47
-
48
-
49
-
50
-
51
-
52
-
53
-
54
-
55
-
56
-
57
-
58
-
59
-
60
-
61
-
62
-
63
-
64
-
65
-
66
-
67
-
68
-
69
-
70
-
71
-
72
-
73
-
74
-
75
-
76
-
77
-
78
-
79
-
80
-
81
-
82
-
83
-
84
-
85
-
86
-
87
-
88
-
89
-
90
-
91
-
92
-
93
-
94
-
95
-
96
-
97
-
98
-
99
-
100
-
101
-
102
-
103
-
104
-
105
-
106
-
107
-
108
-
109
-
110
-
111
-
112
-
113
-
114
-
115
-
116
-
117
-
118
-
119
-
120
-
121
-
122
-
123
-
124
-
125
-
126
-
127
-
128
-
129
-
130
-
131
-
132
-
133
-
134
-
135
-
136
-
137
-
138
-
139
-
140
-
141
-
142
-
143
-
144
-
145
-
146
-
147
-
148
-
149
-
150
-
151
-
152
-
153
-
154
-
155
-
156
-
157
-
158
-
159
-
160
-
161
-
162
-
163
-
164
-
165
-
166
-
167
-
168
-
169
-
170
-
171
-
172
-
173
-
174
-
175
-
176
-
177
-
178
-
179
-
180
-
181
-
182
-
183
-
184
-
185
-
186
-
187
-
188
-
189
-
190
-
191
-
192
-
193
-
194
-
195
-
196
-
197
-
198
-
 199
199 -
 200
200 -
 201
201 -
 202
202 -
 203
203 -
 204
204 -
 205
205 -
 206
206 -
 207
207 -
 208
208 -
 209
209 -
 210
210 -
 211
211 -
 212
212 -
 213
213 -
 214
214 -
 215
215 -
 216
216 -
 217
217 -
 218
218 -
 219
219 -
220
-
221
-
222
-
223
-
224
-
225
-
226
-
227
-
228
-
229
-
230
-
231
-
232
-
233
-
234
-
235
-
236
-
237
-
238
-
239
-
240
-
241
-
242
-
243
-
244
-
245
-
246
-
247
-
248
-
249
-
250
-
251
-
252
-
253
-
254
-
255
-
256
-
257
-
258
-
259
-
260
-
261
-
262
-
263
-
264
-
265
-
266
-
267
-
268
-
269
-
270
-
271
-
272
-
273
-
274
-
275
-
276
-
277
-
278
-
279
-
280
-
281
-
282
-
283
-
284
-
285
-
286
-
287
-
288
-
289
-
290
-
291
-
292
-
293
-
294
-
295
-
296
-
297
-
298
-
299
-
300
-
301
-
302
-
303
-
304
-
305
-
306
-
307
-
308
-
309
-
310
-
311
-
312
-
313
-
314
-
315
-
316
-
317
-
318
-
319
-
320
-
321
-
322
-
323
-
324
-
325
-
326
-
327
-
328
-
329
-
330
-
331
-
332
-
333
-
334
-
335
-
336
-
337
-
338
-
339
-
340
-
341
-
342
-
343
-
344
-
345
-
346
-
347
-
348
-
349
-
350
-
351
-
352
-
353
-
354
-
355
-
356
-
357
-
358
-
359
-
360
-
361
-
362
-
363
-
364
-
365
-
366
-
367
-
368
-
369
-
370
-
371
-
372
-
373
-
374
-
375
-
376
-
377
-
378
-
379
-
380
-
381
-
382
-
383
-
384
-
385
-
386
-
387
-
388
-
389
-
390
-
391
-
392
-
393
-
394
-
395
-
396
-
397
-
398
-
399
-
400
-
401
-
402
 |
 |

Consolidated
Financial
Statements
at 31 December
2011
Notes
208
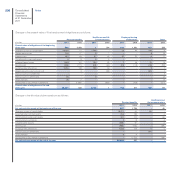
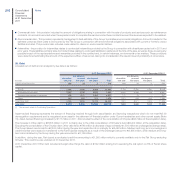
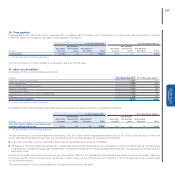
The present value of the defined benefit obligations, the fair value of plan assets and the surplus or deficit of the plans at the end of 2011 and the four
previous years are as follows:
(€ million)
At 31 December
2011
At 31 December
2010 (*)
At 31 December
2009
At 31 December
2008
At 31 December
2007
Present value of obligation:
Pension benefits 25,201 522 2,568 2,267 2,730
Health care and life insurance plans 2,070 1 794 848 817
Employee leaving entitlements in Italy 763 811 1,001 1,062 1,133
Others 156 127 258 288 279
Fair value of plan assets:
Pension benefits 20,004 327 1,796 1,554 2,036
Health care and life insurance plans -- 46 39 47
Surplus (deficit) of the plan:
Pension benefits (5,197) (195) (772) (713) (694)
Health care and life insurance plans (2,070) (1) (748) (809) (770)
Employee leaving entitlements in Italy (763) (811) (1,001) (1,062) (1,133)
Others (156) (127) (258) (288) (279)
(*) The amounts relate to Continuing Operations.
The best estimate of expected contributions to pension benefits and health care and life insurance plans for 2012 is as follows:
(€ million) 2012
Pension benefits 509
Health care and life insurance plans 143
Others 5
Total expected contributions 657
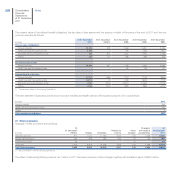
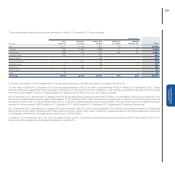
27. Other provisions
Changes in Other provisions are as follows:
(€ million)
At
31 December
2010 (*) Charge Utilisation
Release to
income
Other
changes
Change in
the scope of
consolidation
At
31 December
2011
Warranty provision 970 1,421 (1,135) (202) 220 2,256 3,530
Restructuring provision 202 108 (82) (35) (3) 150 340
Investment provision 26 - - - (2) - 24
Other risks 2,022 4,424 (4,109) (234) 203 2,398 4,704
Total Other provisions 3,220 5,953 (5,326) (471) 418 4,804 8,598
(*) Amount relates to the Continuing Operations.
The effect of discounting these provisions, €11 million in 2011 has been included in Other changes together with translation gains of €425 million.