Chrysler 2011 Annual Report Download - page 77
Download and view the complete annual report
Please find page 77 of the 2011 Chrysler annual report below. You can navigate through the pages in the report by either clicking on the pages listed below, or by using the keyword search tool below to find specific information within the annual report.-
 1
1 -
2
-
3
-
4
-
5
-
6
-
7
-
8
-
9
-
10
-
11
-
12
-
13
-
14
-
15
-
16
-
17
-
18
-
19
-
20
-
21
-
22
-
23
-
24
-
25
-
26
-
27
-
28
-
29
-
30
-
31
-
32
-
33
-
34
-
35
-
36
-
37
-
38
-
39
-
40
-
41
-
42
-
43
-
44
-
45
-
46
-
47
-
48
-
49
-
50
-
51
-
52
-
53
-
54
-
55
-
56
-
57
-
58
-
59
-
60
-
61
-
62
-
63
-
64
-
65
-
66
-
 67
67 -
 68
68 -
 69
69 -
 70
70 -
 71
71 -
 72
72 -
 73
73 -
 74
74 -
 75
75 -
 76
76 -
 77
77 -
 78
78 -
 79
79 -
 80
80 -
 81
81 -
 82
82 -
 83
83 -
 84
84 -
 85
85 -
 86
86 -
 87
87 -
88
-
89
-
90
-
91
-
92
-
93
-
94
-
95
-
96
-
97
-
98
-
99
-
100
-
101
-
102
-
103
-
104
-
105
-
106
-
107
-
108
-
109
-
110
-
111
-
112
-
113
-
114
-
115
-
116
-
117
-
118
-
119
-
120
-
121
-
122
-
123
-
124
-
125
-
126
-
127
-
128
-
129
-
130
-
131
-
132
-
133
-
134
-
135
-
136
-
137
-
138
-
139
-
140
-
141
-
142
-
143
-
144
-
145
-
146
-
147
-
148
-
149
-
150
-
151
-
152
-
153
-
154
-
155
-
156
-
157
-
158
-
159
-
160
-
161
-
162
-
163
-
164
-
165
-
166
-
167
-
168
-
169
-
170
-
171
-
172
-
173
-
174
-
175
-
176
-
177
-
178
-
179
-
180
-
181
-
182
-
183
-
184
-
185
-
186
-
187
-
188
-
189
-
190
-
191
-
192
-
193
-
194
-
195
-
196
-
197
-
198
-
199
-
200
-
201
-
202
-
203
-
204
-
205
-
206
-
207
-
208
-
209
-
210
-
211
-
212
-
213
-
214
-
215
-
216
-
217
-
218
-
219
-
220
-
221
-
222
-
223
-
224
-
225
-
226
-
227
-
228
-
229
-
230
-
231
-
232
-
233
-
234
-
235
-
236
-
237
-
238
-
239
-
240
-
241
-
242
-
243
-
244
-
245
-
246
-
247
-
248
-
249
-
250
-
251
-
252
-
253
-
254
-
255
-
256
-
257
-
258
-
259
-
260
-
261
-
262
-
263
-
264
-
265
-
266
-
267
-
268
-
269
-
270
-
271
-
272
-
273
-
274
-
275
-
276
-
277
-
278
-
279
-
280
-
281
-
282
-
283
-
284
-
285
-
286
-
287
-
288
-
289
-
290
-
291
-
292
-
293
-
294
-
295
-
296
-
297
-
298
-
299
-
300
-
301
-
302
-
303
-
304
-
305
-
306
-
307
-
308
-
309
-
310
-
311
-
312
-
313
-
314
-
315
-
316
-
317
-
318
-
319
-
320
-
321
-
322
-
323
-
324
-
325
-
326
-
327
-
328
-
329
-
330
-
331
-
332
-
333
-
334
-
335
-
336
-
337
-
338
-
339
-
340
-
341
-
342
-
343
-
344
-
345
-
346
-
347
-
348
-
349
-
350
-
351
-
352
-
353
-
354
-
355
-
356
-
357
-
358
-
359
-
360
-
361
-
362
-
363
-
364
-
365
-
366
-
367
-
368
-
369
-
370
-
371
-
372
-
373
-
374
-
375
-
376
-
377
-
378
-
379
-
380
-
381
-
382
-
383
-
384
-
385
-
386
-
387
-
388
-
389
-
390
-
391
-
392
-
393
-
394
-
395
-
396
-
397
-
398
-
399
-
400
-
401
-
402
 |
 |

Report on
Operations
76
Financial
Review –
Fiat Group
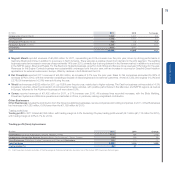
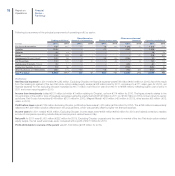
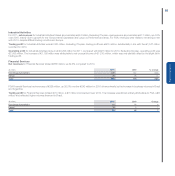
Following are details of trading profit by business/sector:
Automobiles
The Automobiles businesses reported trading profit of €2,127 million for 2011, including the contribution from Chrysler of €1,345 million for the period
June-December 2011.
(€ million) 2011 2010 Change
Fiat Group Automobiles 430 607 -177
Chrysler 1,345 - 1,345
Maserati 40 24 16
Ferrari 312 303 9
Total 2,127 934 1,193
Trading margin (%) 4.0 3.1
Fiat Group Automobiles closed the year with a trading profit of €430 million (1.5% trading margin), compared with €607 million (2.2% margin) for 2010.
Efficiencies in purchasing and World Class Manufacturing only partially offset volume declines for passenger cars in Europe, in addition to an increase in
advertising costs related to new model launches and higher R&D expenditure for future products.
Chrysler reported trading profit of €1,345 million for the period June-December, driven by a continued positive trend in volume, mix and pricing for new
vehicles in both the U.S. and Canada. Trading margin benefited from a low amortization charge for R&D, as current spending relates to products still in
development.
Maserati posted a trading profit of €40 million for 2011 (6.8% trading margin), a significant increase over 2010 (€24 million, 4.1% trading margin)
attributable to an improved mix and further optimization of operating costs.
Ferrari closed 2011 with a trading profit of €312 million (13.9% trading margin), compared to €303 million for 2010. The increase was attributable to
higher sales volumes and a more favorable product mix, partially offset by higher R&D expenditure.
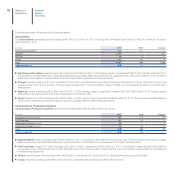
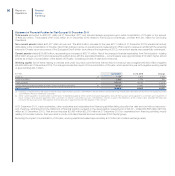
Components & Production Systems
Components & Production Systems reported 2011 trading profit of €348 million (+40% over 2010).
(€ million) 2011 2010 Change
Components (Magneti Marelli) 181 98 83
Fiat Powertrain 131 140 -9
Metallurgical Products (Teksid) 26 17 9
Production Systems (Comau) 10 (6) 16
Total 348 249 99
Trading margin (%) 2.9 2.3
Magneti Marelli posted a trading profit of €181 million for 2011, compared to €98 million for the previous year. The improvement was driven by higher
sales volumes and manufacturing efficiencies, which more than compensated for cost pressures from higher materials prices.
Fiat Powertrain closed 2011 with a trading profit of €131 million, compared to €140 million for 2010. The reduction was principally attributable to
an increase in raw material costs and in costs associated with new products. Both of these factors were only partially compensated by overhead and
manufacturing efficiencies.
Teksid closed the year with a trading profit of €26 million, compared to €17 million for 2010, reflecting the positive trend in volumes.
Comau reported a trading profit of €10 million for 2011, compared with a trading loss of €6 million for 2010.