Chrysler 2011 Annual Report Download - page 181
Download and view the complete annual report
Please find page 181 of the 2011 Chrysler annual report below. You can navigate through the pages in the report by either clicking on the pages listed below, or by using the keyword search tool below to find specific information within the annual report.-
 1
1 -
2
-
3
-
4
-
5
-
6
-
7
-
8
-
9
-
10
-
11
-
12
-
13
-
14
-
15
-
16
-
17
-
18
-
19
-
20
-
21
-
22
-
23
-
24
-
25
-
26
-
27
-
28
-
29
-
30
-
31
-
32
-
33
-
34
-
35
-
36
-
37
-
38
-
39
-
40
-
41
-
42
-
43
-
44
-
45
-
46
-
47
-
48
-
49
-
50
-
51
-
52
-
53
-
54
-
55
-
56
-
57
-
58
-
59
-
60
-
61
-
62
-
63
-
64
-
65
-
66
-
67
-
68
-
69
-
70
-
71
-
72
-
73
-
74
-
75
-
76
-
77
-
78
-
79
-
80
-
81
-
82
-
83
-
84
-
85
-
86
-
87
-
88
-
89
-
90
-
91
-
92
-
93
-
94
-
95
-
96
-
97
-
98
-
99
-
100
-
101
-
102
-
103
-
104
-
105
-
106
-
107
-
108
-
109
-
110
-
111
-
112
-
113
-
114
-
115
-
116
-
117
-
118
-
119
-
120
-
121
-
122
-
123
-
124
-
125
-
126
-
127
-
128
-
129
-
130
-
131
-
132
-
133
-
134
-
135
-
136
-
137
-
138
-
139
-
140
-
141
-
142
-
143
-
144
-
145
-
146
-
147
-
148
-
149
-
150
-
151
-
152
-
153
-
154
-
155
-
156
-
157
-
158
-
159
-
160
-
161
-
162
-
163
-
164
-
165
-
166
-
167
-
168
-
169
-
170
-
 171
171 -
 172
172 -
 173
173 -
 174
174 -
 175
175 -
 176
176 -
 177
177 -
 178
178 -
 179
179 -
 180
180 -
 181
181 -
 182
182 -
 183
183 -
 184
184 -
 185
185 -
 186
186 -
 187
187 -
 188
188 -
 189
189 -
 190
190 -
 191
191 -
192
-
193
-
194
-
195
-
196
-
197
-
198
-
199
-
200
-
201
-
202
-
203
-
204
-
205
-
206
-
207
-
208
-
209
-
210
-
211
-
212
-
213
-
214
-
215
-
216
-
217
-
218
-
219
-
220
-
221
-
222
-
223
-
224
-
225
-
226
-
227
-
228
-
229
-
230
-
231
-
232
-
233
-
234
-
235
-
236
-
237
-
238
-
239
-
240
-
241
-
242
-
243
-
244
-
245
-
246
-
247
-
248
-
249
-
250
-
251
-
252
-
253
-
254
-
255
-
256
-
257
-
258
-
259
-
260
-
261
-
262
-
263
-
264
-
265
-
266
-
267
-
268
-
269
-
270
-
271
-
272
-
273
-
274
-
275
-
276
-
277
-
278
-
279
-
280
-
281
-
282
-
283
-
284
-
285
-
286
-
287
-
288
-
289
-
290
-
291
-
292
-
293
-
294
-
295
-
296
-
297
-
298
-
299
-
300
-
301
-
302
-
303
-
304
-
305
-
306
-
307
-
308
-
309
-
310
-
311
-
312
-
313
-
314
-
315
-
316
-
317
-
318
-
319
-
320
-
321
-
322
-
323
-
324
-
325
-
326
-
327
-
328
-
329
-
330
-
331
-
332
-
333
-
334
-
335
-
336
-
337
-
338
-
339
-
340
-
341
-
342
-
343
-
344
-
345
-
346
-
347
-
348
-
349
-
350
-
351
-
352
-
353
-
354
-
355
-
356
-
357
-
358
-
359
-
360
-
361
-
362
-
363
-
364
-
365
-
366
-
367
-
368
-
369
-
370
-
371
-
372
-
373
-
374
-
375
-
376
-
377
-
378
-
379
-
380
-
381
-
382
-
383
-
384
-
385
-
386
-
387
-
388
-
389
-
390
-
391
-
392
-
393
-
394
-
395
-
396
-
397
-
398
-
399
-
400
-
401
-
402
 |
 |

Consolidated
Financial
Statements
at 31 December
2011
Notes
180
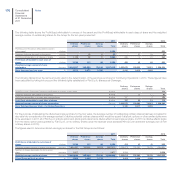
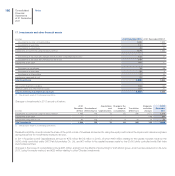
17. Investments and other financial assets
(€ million) At 31 December 2011 At 31 December 2010 (*)
Investments in jointly controlled entities 1,400 1,323
Investments in associates 131 117
Investments in subsidiaries 48 25
Investments accounted for using the equity method 1,579 1,465
Investments at fair value with changes directly in other comprehensive income 116 17
Investments at fair value with changes in profit or loss 149 -
Investments at fair value 265 17
Investment in subsidiaries 18 48
Investments in associates 20 4
Investments in other entities 17 10
Investments measured at cost 55 62
Total Investments 1,899 1,544
Non-current financial receivables 334 62
Other securities and other financial assets 427 47
Total Investments and other financial assets 2,660 1,653
(*) The amounts relate to Continuing Operations.
Changes in Investments in 2011 are set out below:
(€ million)
At 31
December
2010 (*)
Revaluations/
(Write-downs)
Acquisitions
and
Capitalisations
Change in the
scope of
consolidation
Translation
differences
Disposals
and other
changes
At 31
December
2011
Investments accounted for using the equity method 1,465 146 78 55 (38) (127) 1,579
Investments at fair value 17 - - - - 248 265
Investments measured at cost 62 (23) 1 3 (2) 14 55
Total Investments 1,544 123 79 58 (40) 135 1,899
(*) The amounts relate to Continuing Operations.
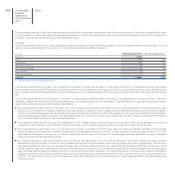
Revaluations/(Write-downs) include the share of the profit or loss of investees accounted for using the equity method and the impairment losses recognised
during the period for investments measured at cost.
In 2011 Acquisitions and Capitalisations amount to €79 million (€132 million in 2010), of which €49 million relating to the capital increase made by the
50/50 jointly controlled entity GAC Fiat Automobiles Co. Ltd. and €7 million to the capital increase made by the 50/50 jointly controlled entity Fiat India
Automobiles Limited.
Changes in the scope of consolidation include €35 million arising from the effects of accounting for V.M. Motori group, a joint venture acquired on 29 June
2011, using the equity method, and €26 million relating to other Chrysler investments.