Chrysler 2011 Annual Report Download - page 172
Download and view the complete annual report
Please find page 172 of the 2011 Chrysler annual report below. You can navigate through the pages in the report by either clicking on the pages listed below, or by using the keyword search tool below to find specific information within the annual report.-
 1
1 -
2
-
3
-
4
-
5
-
6
-
7
-
8
-
9
-
10
-
11
-
12
-
13
-
14
-
15
-
16
-
17
-
18
-
19
-
20
-
21
-
22
-
23
-
24
-
25
-
26
-
27
-
28
-
29
-
30
-
31
-
32
-
33
-
34
-
35
-
36
-
37
-
38
-
39
-
40
-
41
-
42
-
43
-
44
-
45
-
46
-
47
-
48
-
49
-
50
-
51
-
52
-
53
-
54
-
55
-
56
-
57
-
58
-
59
-
60
-
61
-
62
-
63
-
64
-
65
-
66
-
67
-
68
-
69
-
70
-
71
-
72
-
73
-
74
-
75
-
76
-
77
-
78
-
79
-
80
-
81
-
82
-
83
-
84
-
85
-
86
-
87
-
88
-
89
-
90
-
91
-
92
-
93
-
94
-
95
-
96
-
97
-
98
-
99
-
100
-
101
-
102
-
103
-
104
-
105
-
106
-
107
-
108
-
109
-
110
-
111
-
112
-
113
-
114
-
115
-
116
-
117
-
118
-
119
-
120
-
121
-
122
-
123
-
124
-
125
-
126
-
127
-
128
-
129
-
130
-
131
-
132
-
133
-
134
-
135
-
136
-
137
-
138
-
139
-
140
-
141
-
142
-
143
-
144
-
145
-
146
-
147
-
148
-
149
-
150
-
151
-
152
-
153
-
154
-
155
-
156
-
157
-
158
-
159
-
160
-
161
-
 162
162 -
 163
163 -
 164
164 -
 165
165 -
 166
166 -
 167
167 -
 168
168 -
 169
169 -
 170
170 -
 171
171 -
 172
172 -
 173
173 -
 174
174 -
 175
175 -
 176
176 -
 177
177 -
 178
178 -
 179
179 -
 180
180 -
 181
181 -
 182
182 -
183
-
184
-
185
-
186
-
187
-
188
-
189
-
190
-
191
-
192
-
193
-
194
-
195
-
196
-
197
-
198
-
199
-
200
-
201
-
202
-
203
-
204
-
205
-
206
-
207
-
208
-
209
-
210
-
211
-
212
-
213
-
214
-
215
-
216
-
217
-
218
-
219
-
220
-
221
-
222
-
223
-
224
-
225
-
226
-
227
-
228
-
229
-
230
-
231
-
232
-
233
-
234
-
235
-
236
-
237
-
238
-
239
-
240
-
241
-
242
-
243
-
244
-
245
-
246
-
247
-
248
-
249
-
250
-
251
-
252
-
253
-
254
-
255
-
256
-
257
-
258
-
259
-
260
-
261
-
262
-
263
-
264
-
265
-
266
-
267
-
268
-
269
-
270
-
271
-
272
-
273
-
274
-
275
-
276
-
277
-
278
-
279
-
280
-
281
-
282
-
283
-
284
-
285
-
286
-
287
-
288
-
289
-
290
-
291
-
292
-
293
-
294
-
295
-
296
-
297
-
298
-
299
-
300
-
301
-
302
-
303
-
304
-
305
-
306
-
307
-
308
-
309
-
310
-
311
-
312
-
313
-
314
-
315
-
316
-
317
-
318
-
319
-
320
-
321
-
322
-
323
-
324
-
325
-
326
-
327
-
328
-
329
-
330
-
331
-
332
-
333
-
334
-
335
-
336
-
337
-
338
-
339
-
340
-
341
-
342
-
343
-
344
-
345
-
346
-
347
-
348
-
349
-
350
-
351
-
352
-
353
-
354
-
355
-
356
-
357
-
358
-
359
-
360
-
361
-
362
-
363
-
364
-
365
-
366
-
367
-
368
-
369
-
370
-
371
-
372
-
373
-
374
-
375
-
376
-
377
-
378
-
379
-
380
-
381
-
382
-
383
-
384
-
385
-
386
-
387
-
388
-
389
-
390
-
391
-
392
-
393
-
394
-
395
-
396
-
397
-
398
-
399
-
400
-
401
-
402
 |
 |

171
Consolidated
Financial Statements
at 31 December 2011
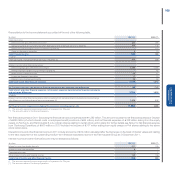
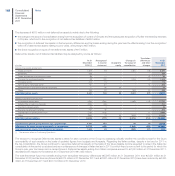
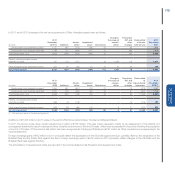
The figures used to determine diluted earnings per shares for the Continuing Operations in 2010 are as follows:
2010
Ordinary
shares
Preference
shares
Savings
shares Total
Profit/(Loss) from Continuing Operations attributable to each class of shares € million 137 23 19 179
Weighted average number of shares outstanding thousand 1,053,679 103,292 79,913 1,236,884
Number of shares deployable for stock option plans thousand 5,936 - - 5,936
Weighted average number of shares thousand 1,059,615 103,292 79,913 1,242,820
Diluted Earnings/(loss) per share – Continuing Operations €0.130 0.217 0.238
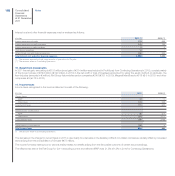
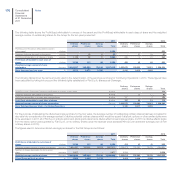
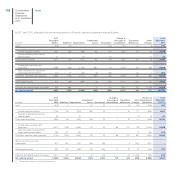
14. Goodwill and intangible assets with indefinite useful lives
In 2011 and 2010, changes in the gross carrying amount of Goodwill and intangible assets with indefinite useful lives were as follows:
(€ million)
At 31
December
2010 (*) Additions
Change in
the scope of
consolidation
Impairment
losses
Translation
differences
and other
changes
At 31
December
2011
Gross amount 1,272 - 8,621 - 971 10,864
Accumulated impairment losses (192) - - (224) (5) (421)
Goodwill 1,080 - 8,621 (224) 966 10,443
Brands 3 - 2,489 - 278 2,770
Goodwill and intangible assets with indefinite useful lives 1,083 - 11,110 (224) 1,244 13,213
(€ million)
At 31
December
2009 Additions
Change in
the scope of
consolidation
Impairment
losses
Translation
differences
and other
changes
Reclassified
to
Discontinued
Operations
At 31
December
2010 (*)
Gross amount 3,437 - - - 194 (2,359) 1,272
Accumulated impairment losses (661) - - - (42) 511 (192)
Goodwill 2,776 - - - 152 (1,848) 1,080
Brands 165 - - - 12 (174) 3
Goodwill and intangible assets with indefinite useful lives 2,941 - - - 164 (2,022) 1,083
(*) The amounts relate to Continuing Operations.
The increases in Goodwill and Brands arise from the acquisition of the control of Chrysler and its subsequent consolidation.
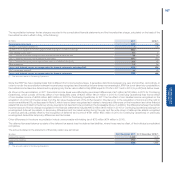
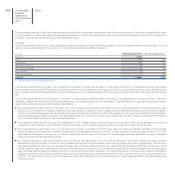
Brands
Brands arise almost exclusively from the Chrysler sector. The amount of €2,770 million at 31 December 2011 mainly comprises the net carrying amount
of the brands Chrysler, Dodge, Ram, Jeep and Mopar. These rights are protected legally through registration with government agencies and through the
continuous use in commerce. As these rights have no legal, contractual, competitive or economic term that limits their useful lives, they were classified as
intangible assets with indefinite useful lives.