Chrysler 2011 Annual Report Download - page 31
Download and view the complete annual report
Please find page 31 of the 2011 Chrysler annual report below. You can navigate through the pages in the report by either clicking on the pages listed below, or by using the keyword search tool below to find specific information within the annual report.-
 1
1 -
2
-
3
-
4
-
5
-
6
-
7
-
8
-
9
-
10
-
11
-
12
-
13
-
14
-
15
-
16
-
17
-
18
-
19
-
20
-
 21
21 -
 22
22 -
 23
23 -
 24
24 -
 25
25 -
 26
26 -
 27
27 -
 28
28 -
 29
29 -
 30
30 -
 31
31 -
 32
32 -
 33
33 -
 34
34 -
 35
35 -
 36
36 -
 37
37 -
 38
38 -
 39
39 -
 40
40 -
 41
41 -
42
-
43
-
44
-
45
-
46
-
47
-
48
-
49
-
50
-
51
-
52
-
53
-
54
-
55
-
56
-
57
-
58
-
59
-
60
-
61
-
62
-
63
-
64
-
65
-
66
-
67
-
68
-
69
-
70
-
71
-
72
-
73
-
74
-
75
-
76
-
77
-
78
-
79
-
80
-
81
-
82
-
83
-
84
-
85
-
86
-
87
-
88
-
89
-
90
-
91
-
92
-
93
-
94
-
95
-
96
-
97
-
98
-
99
-
100
-
101
-
102
-
103
-
104
-
105
-
106
-
107
-
108
-
109
-
110
-
111
-
112
-
113
-
114
-
115
-
116
-
117
-
118
-
119
-
120
-
121
-
122
-
123
-
124
-
125
-
126
-
127
-
128
-
129
-
130
-
131
-
132
-
133
-
134
-
135
-
136
-
137
-
138
-
139
-
140
-
141
-
142
-
143
-
144
-
145
-
146
-
147
-
148
-
149
-
150
-
151
-
152
-
153
-
154
-
155
-
156
-
157
-
158
-
159
-
160
-
161
-
162
-
163
-
164
-
165
-
166
-
167
-
168
-
169
-
170
-
171
-
172
-
173
-
174
-
175
-
176
-
177
-
178
-
179
-
180
-
181
-
182
-
183
-
184
-
185
-
186
-
187
-
188
-
189
-
190
-
191
-
192
-
193
-
194
-
195
-
196
-
197
-
198
-
199
-
200
-
201
-
202
-
203
-
204
-
205
-
206
-
207
-
208
-
209
-
210
-
211
-
212
-
213
-
214
-
215
-
216
-
217
-
218
-
219
-
220
-
221
-
222
-
223
-
224
-
225
-
226
-
227
-
228
-
229
-
230
-
231
-
232
-
233
-
234
-
235
-
236
-
237
-
238
-
239
-
240
-
241
-
242
-
243
-
244
-
245
-
246
-
247
-
248
-
249
-
250
-
251
-
252
-
253
-
254
-
255
-
256
-
257
-
258
-
259
-
260
-
261
-
262
-
263
-
264
-
265
-
266
-
267
-
268
-
269
-
270
-
271
-
272
-
273
-
274
-
275
-
276
-
277
-
278
-
279
-
280
-
281
-
282
-
283
-
284
-
285
-
286
-
287
-
288
-
289
-
290
-
291
-
292
-
293
-
294
-
295
-
296
-
297
-
298
-
299
-
300
-
301
-
302
-
303
-
304
-
305
-
306
-
307
-
308
-
309
-
310
-
311
-
312
-
313
-
314
-
315
-
316
-
317
-
318
-
319
-
320
-
321
-
322
-
323
-
324
-
325
-
326
-
327
-
328
-
329
-
330
-
331
-
332
-
333
-
334
-
335
-
336
-
337
-
338
-
339
-
340
-
341
-
342
-
343
-
344
-
345
-
346
-
347
-
348
-
349
-
350
-
351
-
352
-
353
-
354
-
355
-
356
-
357
-
358
-
359
-
360
-
361
-
362
-
363
-
364
-
365
-
366
-
367
-
368
-
369
-
370
-
371
-
372
-
373
-
374
-
375
-
376
-
377
-
378
-
379
-
380
-
381
-
382
-
383
-
384
-
385
-
386
-
387
-
388
-
389
-
390
-
391
-
392
-
393
-
394
-
395
-
396
-
397
-
398
-
399
-
400
-
401
-
402
 |
 |

30 Report on
Operations
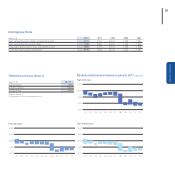
Highlights
Highlights
2011 2010 2009
(€ million)
Fiat
with
Chrysler (*)
Fiat
excluding
Chrysler Fiat Fiat
Net revenues 59,559 37,382 35,880 32,684
Trading profit/(loss) 2,392 1,047 1,112 736
Operating profit/(loss) 3,336 2,136 992 378
Profit/(loss) before taxes 2,185 1,470 706 103
Profit/(loss) for the year 1,651 1,006 222 (345)
Attributable to:
Owners of the parent 1,334 980 179 (374)
Non-controlling interests 317 26 43 29
Basic earnings/(loss) per ordinary share (€)(1) 1.071 - 0.130 (0.302)
Basic earnings/(loss) per preference share (€)(1) 1.071 - 0.217 (0.302)
Basic earnings/(loss) per savings share (€)(1) 1.180 - 0.239 (0.302)
Diluted earnings/(loss) per ordinary share (€)(1) 1.063 - 0.130 (0.302)
Diluted earnings/(loss) per preference share (€)(1) 1.063 - 0.217 (0.302)
Diluted earnings/(loss) per savings share (€)(1) 1.172 - 0.238 (0.302)
Investments in tangible and intangible assets 5,528 3,592 2,864 2,684
of which: capitalized R&D costs 1,438 1,059 886 748
R&D expenditure (2) 2,175 1,411 1,284 1,154
Net industrial debt 5,529 2,449 542 3,103
Employees at year end 197,021 141,334 137,801 128,771
(*) Includes Chrysler from June 2011
(1) Note 13 to the Consolidated Financial Statements provides additional information on the calculation of basic and diluted earnings per share
(2) Includes capitalized R&D and R&D charged directly to the income statement
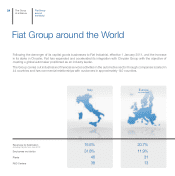
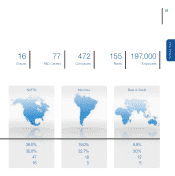
Select data by region
Companies Employees Plants R&D Centers
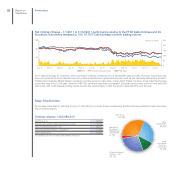
Revenues by market
(€ million)
2011 2010 2011 2010 2011 2010 2011 2010 2011 (*) 2010
Italy 113 112 62,583 63,214 46 44 38 30 9,258 9,782
Europe (excluding Italy) 167 147 23,596 24,616 31 29 13 13 12,363 11,857
NAFTA 84 35 60,336 5,579 47 11 16 521,423 1,270
Mercosur 30 27 44,668 39,498 19 18 5 511,298 10,027
Other regions 78 57 5,838 4,894 12 11 555,217 2,944
Total 472 378 197,021 137,801 155 113 77 58 59,559 35,880
(*) Includes Chrysler from June 2011