Chrysler 2011 Annual Report Download - page 377
Download and view the complete annual report
Please find page 377 of the 2011 Chrysler annual report below. You can navigate through the pages in the report by either clicking on the pages listed below, or by using the keyword search tool below to find specific information within the annual report.-
 1
1 -
2
-
3
-
4
-
5
-
6
-
7
-
8
-
9
-
10
-
11
-
12
-
13
-
14
-
15
-
16
-
17
-
18
-
19
-
20
-
21
-
22
-
23
-
24
-
25
-
26
-
27
-
28
-
29
-
30
-
31
-
32
-
33
-
34
-
35
-
36
-
37
-
38
-
39
-
40
-
41
-
42
-
43
-
44
-
45
-
46
-
47
-
48
-
49
-
50
-
51
-
52
-
53
-
54
-
55
-
56
-
57
-
58
-
59
-
60
-
61
-
62
-
63
-
64
-
65
-
66
-
67
-
68
-
69
-
70
-
71
-
72
-
73
-
74
-
75
-
76
-
77
-
78
-
79
-
80
-
81
-
82
-
83
-
84
-
85
-
86
-
87
-
88
-
89
-
90
-
91
-
92
-
93
-
94
-
95
-
96
-
97
-
98
-
99
-
100
-
101
-
102
-
103
-
104
-
105
-
106
-
107
-
108
-
109
-
110
-
111
-
112
-
113
-
114
-
115
-
116
-
117
-
118
-
119
-
120
-
121
-
122
-
123
-
124
-
125
-
126
-
127
-
128
-
129
-
130
-
131
-
132
-
133
-
134
-
135
-
136
-
137
-
138
-
139
-
140
-
141
-
142
-
143
-
144
-
145
-
146
-
147
-
148
-
149
-
150
-
151
-
152
-
153
-
154
-
155
-
156
-
157
-
158
-
159
-
160
-
161
-
162
-
163
-
164
-
165
-
166
-
167
-
168
-
169
-
170
-
171
-
172
-
173
-
174
-
175
-
176
-
177
-
178
-
179
-
180
-
181
-
182
-
183
-
184
-
185
-
186
-
187
-
188
-
189
-
190
-
191
-
192
-
193
-
194
-
195
-
196
-
197
-
198
-
199
-
200
-
201
-
202
-
203
-
204
-
205
-
206
-
207
-
208
-
209
-
210
-
211
-
212
-
213
-
214
-
215
-
216
-
217
-
218
-
219
-
220
-
221
-
222
-
223
-
224
-
225
-
226
-
227
-
228
-
229
-
230
-
231
-
232
-
233
-
234
-
235
-
236
-
237
-
238
-
239
-
240
-
241
-
242
-
243
-
244
-
245
-
246
-
247
-
248
-
249
-
250
-
251
-
252
-
253
-
254
-
255
-
256
-
257
-
258
-
259
-
260
-
261
-
262
-
263
-
264
-
265
-
266
-
267
-
268
-
269
-
270
-
271
-
272
-
273
-
274
-
275
-
276
-
277
-
278
-
279
-
280
-
281
-
282
-
283
-
284
-
285
-
286
-
287
-
288
-
289
-
290
-
291
-
292
-
293
-
294
-
295
-
296
-
297
-
298
-
299
-
300
-
301
-
302
-
303
-
304
-
305
-
306
-
307
-
308
-
309
-
310
-
311
-
312
-
313
-
314
-
315
-
316
-
317
-
318
-
319
-
320
-
321
-
322
-
323
-
324
-
325
-
326
-
327
-
328
-
329
-
330
-
331
-
332
-
333
-
334
-
335
-
336
-
337
-
338
-
339
-
340
-
341
-
342
-
343
-
344
-
345
-
346
-
347
-
348
-
349
-
350
-
351
-
352
-
353
-
354
-
355
-
356
-
357
-
358
-
359
-
360
-
361
-
362
-
363
-
364
-
365
-
366
-
 367
367 -
 368
368 -
 369
369 -
 370
370 -
 371
371 -
 372
372 -
 373
373 -
 374
374 -
 375
375 -
 376
376 -
 377
377 -
 378
378 -
 379
379 -
 380
380 -
 381
381 -
 382
382 -
 383
383 -
 384
384 -
 385
385 -
 386
386 -
 387
387 -
388
-
389
-
390
-
391
-
392
-
393
-
394
-
395
-
396
-
397
-
398
-
399
-
400
-
401
-
402
 |
 |
Motions
for AGM
376
The following paragraphs include a more detailed analysis of points 3, 4, and 5.
Please note that, for the purposes of its resolutions, the Board of Directors took October 26, 2011 (i.e. the day before the announcement of the
Conversions proposal) as the last reference date with respect to the market price of ordinary, preference and savings shares. This reference date has been
accordingly used for the purposes of the following paragraphs, unless otherwise indicated.
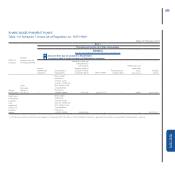
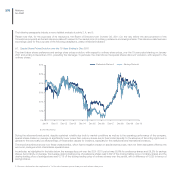
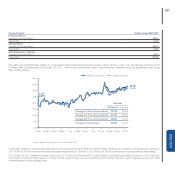
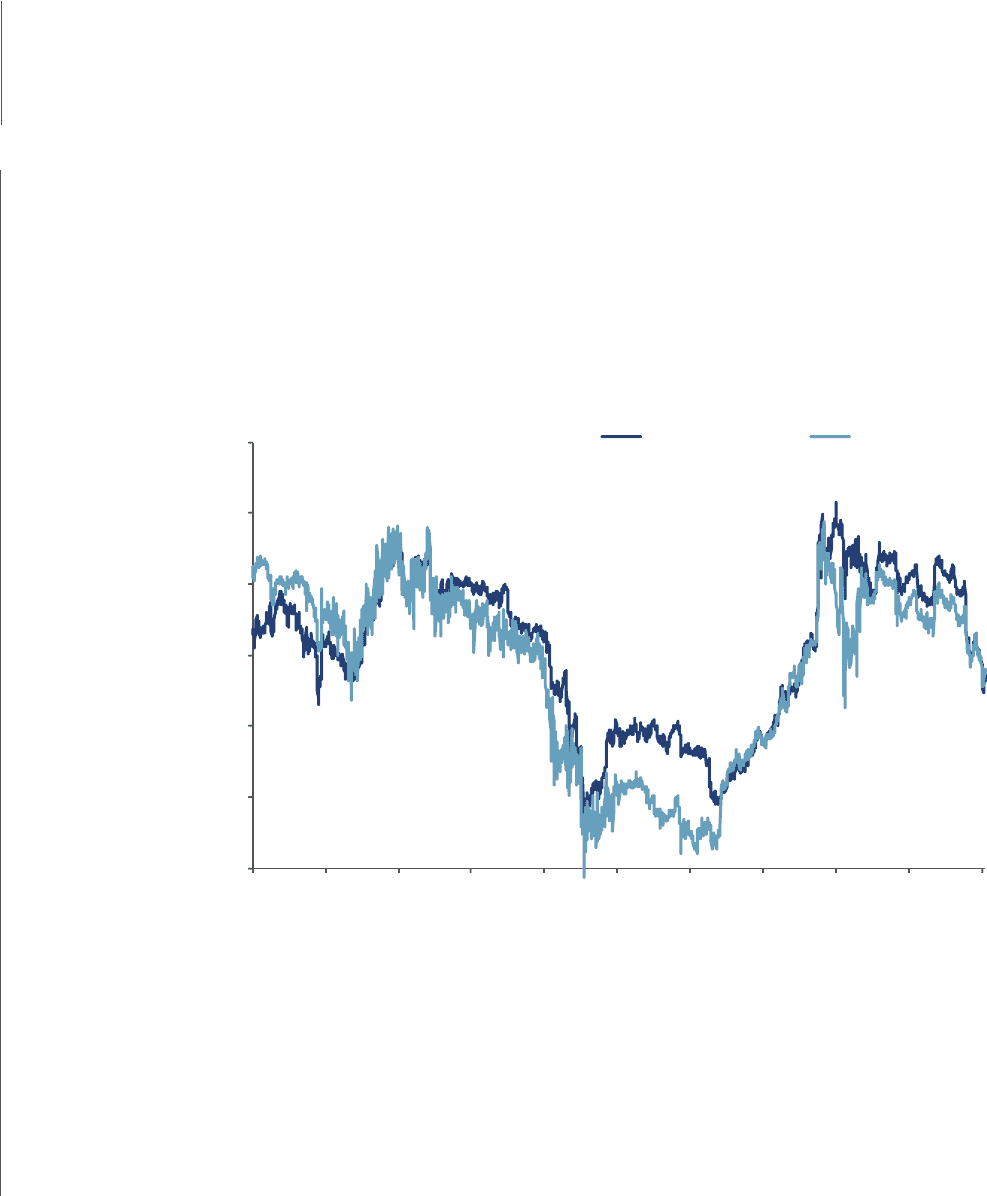
9.1. Special Share Prices Evolution over the 10 Years Ending in Dec-2010
The chart below shows preference and savings share prices evolution, with respect to ordinary share prices, over the 10-year period starting on January
2001 and ending in December 2010, preceding the Demerger. In particular, the chart shows the special shares discount3 evolution, with respect to the
ordinary shares.
Jan 01 Dec 01 Dec 02 Dec 03 Dec 04 Dec 05 Dec 06 Dec 07 Dec 08 Dec 09 Dec 10
Preference Discount Savings Discount
60%
50%
40%
30%
20%
10%
0%
Source: Bloomberg
During the aforementioned period, despite sustained volatility due both to market conditions as well as to the operating performance of the company,
special shares traded on average at significantly lower prices than ordinary shares due to their limited liquidity, to the absence of full voting rights and in
general to the historically low attractiveness of these share classes for investors, especially for the institutional and international investors.
The empirical evidence shows how these characteristics, which have a negative impact on special shares prices, have not been adequately offset by the
economic privileges which characterise special shares.
In particular, as highlighted in the table below, the average discount over the 2001-2010 period was 30.8% for preference shares and 28.2% for savings
shares. Accordingly on average, the average closing trading price of preference shares was 0.692 of the closing trading price of ordinary shares and the
closing trading price of savings share was 0.718 of the closing trading price of ordinary shares over the period, with a difference of 0.025 in favour of
savings shares.
3 Discount calculated as the complement to 1 of the ratios between special share price and ordinary share price.