Chrysler 2011 Annual Report Download - page 187
Download and view the complete annual report
Please find page 187 of the 2011 Chrysler annual report below. You can navigate through the pages in the report by either clicking on the pages listed below, or by using the keyword search tool below to find specific information within the annual report.-
 1
1 -
2
-
3
-
4
-
5
-
6
-
7
-
8
-
9
-
10
-
11
-
12
-
13
-
14
-
15
-
16
-
17
-
18
-
19
-
20
-
21
-
22
-
23
-
24
-
25
-
26
-
27
-
28
-
29
-
30
-
31
-
32
-
33
-
34
-
35
-
36
-
37
-
38
-
39
-
40
-
41
-
42
-
43
-
44
-
45
-
46
-
47
-
48
-
49
-
50
-
51
-
52
-
53
-
54
-
55
-
56
-
57
-
58
-
59
-
60
-
61
-
62
-
63
-
64
-
65
-
66
-
67
-
68
-
69
-
70
-
71
-
72
-
73
-
74
-
75
-
76
-
77
-
78
-
79
-
80
-
81
-
82
-
83
-
84
-
85
-
86
-
87
-
88
-
89
-
90
-
91
-
92
-
93
-
94
-
95
-
96
-
97
-
98
-
99
-
100
-
101
-
102
-
103
-
104
-
105
-
106
-
107
-
108
-
109
-
110
-
111
-
112
-
113
-
114
-
115
-
116
-
117
-
118
-
119
-
120
-
121
-
122
-
123
-
124
-
125
-
126
-
127
-
128
-
129
-
130
-
131
-
132
-
133
-
134
-
135
-
136
-
137
-
138
-
139
-
140
-
141
-
142
-
143
-
144
-
145
-
146
-
147
-
148
-
149
-
150
-
151
-
152
-
153
-
154
-
155
-
156
-
157
-
158
-
159
-
160
-
161
-
162
-
163
-
164
-
165
-
166
-
167
-
168
-
169
-
170
-
171
-
172
-
173
-
174
-
175
-
176
-
 177
177 -
 178
178 -
 179
179 -
 180
180 -
 181
181 -
 182
182 -
 183
183 -
 184
184 -
 185
185 -
 186
186 -
 187
187 -
 188
188 -
 189
189 -
 190
190 -
 191
191 -
 192
192 -
 193
193 -
 194
194 -
 195
195 -
 196
196 -
 197
197 -
198
-
199
-
200
-
201
-
202
-
203
-
204
-
205
-
206
-
207
-
208
-
209
-
210
-
211
-
212
-
213
-
214
-
215
-
216
-
217
-
218
-
219
-
220
-
221
-
222
-
223
-
224
-
225
-
226
-
227
-
228
-
229
-
230
-
231
-
232
-
233
-
234
-
235
-
236
-
237
-
238
-
239
-
240
-
241
-
242
-
243
-
244
-
245
-
246
-
247
-
248
-
249
-
250
-
251
-
252
-
253
-
254
-
255
-
256
-
257
-
258
-
259
-
260
-
261
-
262
-
263
-
264
-
265
-
266
-
267
-
268
-
269
-
270
-
271
-
272
-
273
-
274
-
275
-
276
-
277
-
278
-
279
-
280
-
281
-
282
-
283
-
284
-
285
-
286
-
287
-
288
-
289
-
290
-
291
-
292
-
293
-
294
-
295
-
296
-
297
-
298
-
299
-
300
-
301
-
302
-
303
-
304
-
305
-
306
-
307
-
308
-
309
-
310
-
311
-
312
-
313
-
314
-
315
-
316
-
317
-
318
-
319
-
320
-
321
-
322
-
323
-
324
-
325
-
326
-
327
-
328
-
329
-
330
-
331
-
332
-
333
-
334
-
335
-
336
-
337
-
338
-
339
-
340
-
341
-
342
-
343
-
344
-
345
-
346
-
347
-
348
-
349
-
350
-
351
-
352
-
353
-
354
-
355
-
356
-
357
-
358
-
359
-
360
-
361
-
362
-
363
-
364
-
365
-
366
-
367
-
368
-
369
-
370
-
371
-
372
-
373
-
374
-
375
-
376
-
377
-
378
-
379
-
380
-
381
-
382
-
383
-
384
-
385
-
386
-
387
-
388
-
389
-
390
-
391
-
392
-
393
-
394
-
395
-
396
-
397
-
398
-
399
-
400
-
401
-
402
 |
 |
Consolidated
Financial
Statements
at 31 December
2011
Notes
186
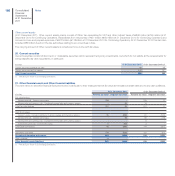
Other current assets
At 31 December 2011, Other current assets mainly consist of Other tax receivables for VAT and other indirect taxes of €848 million (€765 million at 31
December 2010 for Continuing Operation), Receivables from employees of €51 million (€44 million at 31 December 2010 for Continuing Operation) and
Accrued income and prepaid expenses of €378 million (€118million at 31 December 2010 for Continuing Operation). At 31 December 2010 this item also
included €88 million due from the tax authorities relating to eco-incentives in Italy.
The carrying amount of Other current assets is considered to be in line with fair value.
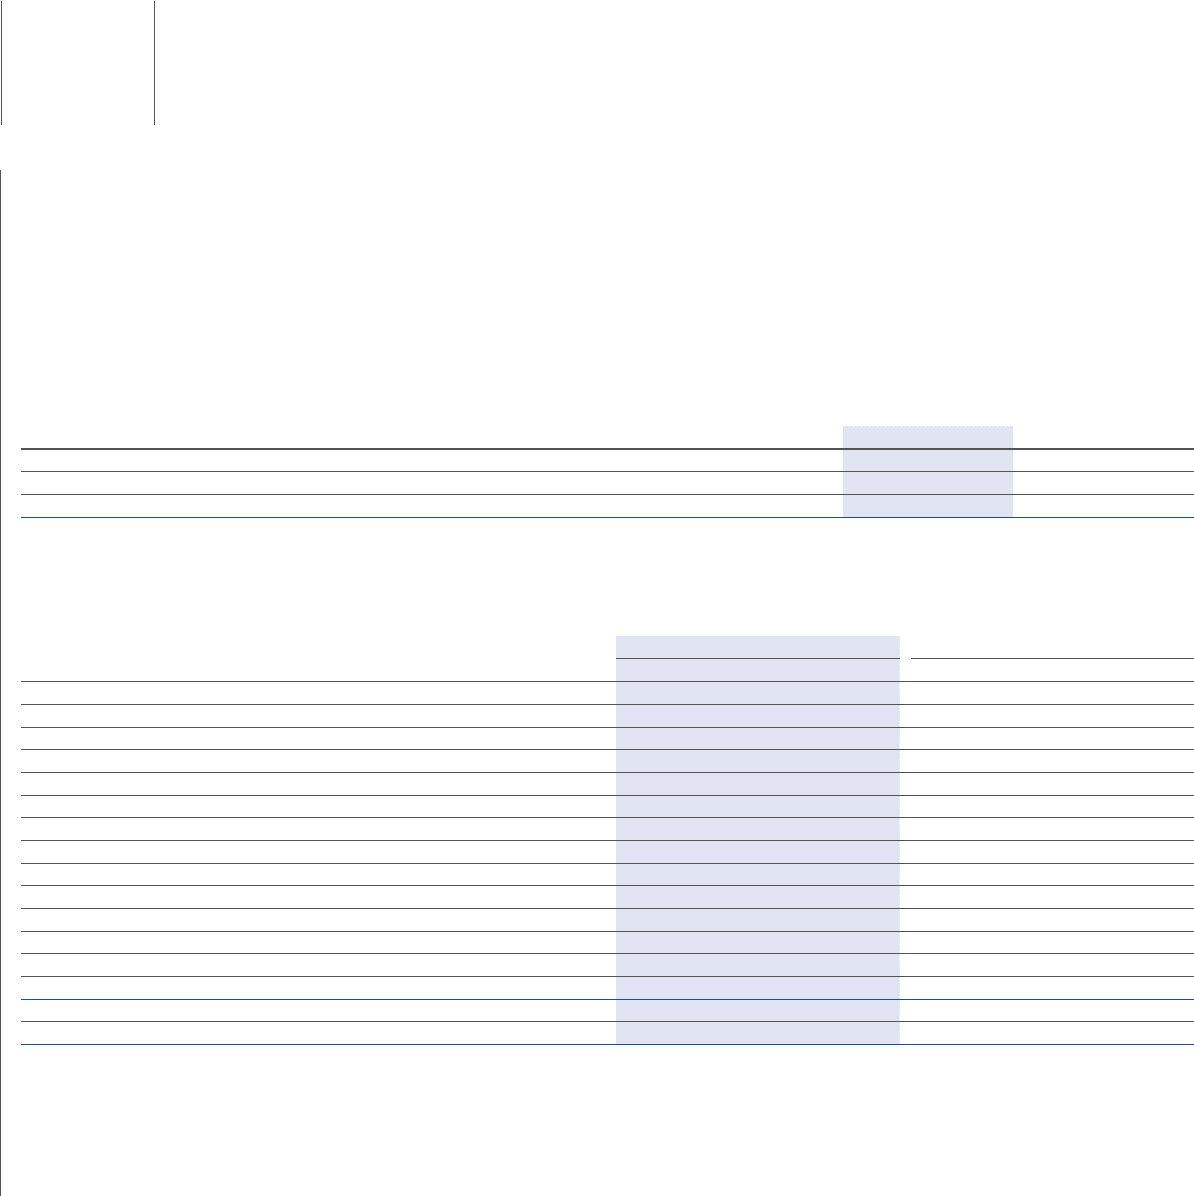
20. Current securities
Current securities consist of short-term or marketable securities which represent temporary investments, but which do not satisfy all the requirements for
being classified as cash equivalents. In particular:
(€ million) At 31 December 2011 At 31 December 2010 (*)
Current securities available-for-sale 52 38
Current securities held for trading 147 147
Total Current securities 199 185
(*) The amounts relate to Continuing Operations.
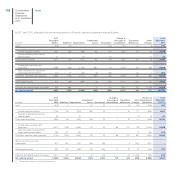
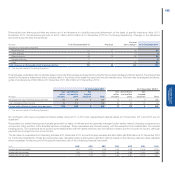
21. Other financial assets and Other financial liabilities
This item refers to derivative financial instruments and in particular to their measurement at fair value at the balance sheet date and to any cash collateral.
At 31 December 2011 At 31 December 2010 (*)
(€ million) Positive fair value Negative fair value Positive fair value Negative fair value
Fair value hedges
Interest rate risk - Interest rate swaps 216 - 226 (7)
Interest rate and currency risk - Combined interest rate and currency swaps 1 (2) 15 -
Total Fair value hedges 217 (2) 241 (7)
Cash flow hedges
Currency risks - Forward contracts, Currency swaps and Currency options 91 (258) 81 (109)
Interest rate risk - Interest rate swaps - (5) 56 (78)
Interest rate and currency risk - Combined interest rate and currency swaps - - 5 -
Commodity price risk – Commodity swap 1 (42) 2 -
Total Cash flow hedges 92 (305) 144 (187)
Derivatives for trading 174 (122) 131 (61)
Fair value of derivative instruments 483 (429) 516 (255)
Cash collateral 74 - - -
Other financial assets/(liabilities) 557 (429) 516 (255)
(*) The amounts relate to Continuing Operations.