Chrysler 2011 Annual Report Download - page 87
Download and view the complete annual report
Please find page 87 of the 2011 Chrysler annual report below. You can navigate through the pages in the report by either clicking on the pages listed below, or by using the keyword search tool below to find specific information within the annual report.-
 1
1 -
2
-
3
-
4
-
5
-
6
-
7
-
8
-
9
-
10
-
11
-
12
-
13
-
14
-
15
-
16
-
17
-
18
-
19
-
20
-
21
-
22
-
23
-
24
-
25
-
26
-
27
-
28
-
29
-
30
-
31
-
32
-
33
-
34
-
35
-
36
-
37
-
38
-
39
-
40
-
41
-
42
-
43
-
44
-
45
-
46
-
47
-
48
-
49
-
50
-
51
-
52
-
53
-
54
-
55
-
56
-
57
-
58
-
59
-
60
-
61
-
62
-
63
-
64
-
65
-
66
-
67
-
68
-
69
-
70
-
71
-
72
-
73
-
74
-
75
-
76
-
 77
77 -
 78
78 -
 79
79 -
 80
80 -
 81
81 -
 82
82 -
 83
83 -
 84
84 -
 85
85 -
 86
86 -
 87
87 -
 88
88 -
 89
89 -
 90
90 -
 91
91 -
 92
92 -
 93
93 -
 94
94 -
 95
95 -
 96
96 -
 97
97 -
98
-
99
-
100
-
101
-
102
-
103
-
104
-
105
-
106
-
107
-
108
-
109
-
110
-
111
-
112
-
113
-
114
-
115
-
116
-
117
-
118
-
119
-
120
-
121
-
122
-
123
-
124
-
125
-
126
-
127
-
128
-
129
-
130
-
131
-
132
-
133
-
134
-
135
-
136
-
137
-
138
-
139
-
140
-
141
-
142
-
143
-
144
-
145
-
146
-
147
-
148
-
149
-
150
-
151
-
152
-
153
-
154
-
155
-
156
-
157
-
158
-
159
-
160
-
161
-
162
-
163
-
164
-
165
-
166
-
167
-
168
-
169
-
170
-
171
-
172
-
173
-
174
-
175
-
176
-
177
-
178
-
179
-
180
-
181
-
182
-
183
-
184
-
185
-
186
-
187
-
188
-
189
-
190
-
191
-
192
-
193
-
194
-
195
-
196
-
197
-
198
-
199
-
200
-
201
-
202
-
203
-
204
-
205
-
206
-
207
-
208
-
209
-
210
-
211
-
212
-
213
-
214
-
215
-
216
-
217
-
218
-
219
-
220
-
221
-
222
-
223
-
224
-
225
-
226
-
227
-
228
-
229
-
230
-
231
-
232
-
233
-
234
-
235
-
236
-
237
-
238
-
239
-
240
-
241
-
242
-
243
-
244
-
245
-
246
-
247
-
248
-
249
-
250
-
251
-
252
-
253
-
254
-
255
-
256
-
257
-
258
-
259
-
260
-
261
-
262
-
263
-
264
-
265
-
266
-
267
-
268
-
269
-
270
-
271
-
272
-
273
-
274
-
275
-
276
-
277
-
278
-
279
-
280
-
281
-
282
-
283
-
284
-
285
-
286
-
287
-
288
-
289
-
290
-
291
-
292
-
293
-
294
-
295
-
296
-
297
-
298
-
299
-
300
-
301
-
302
-
303
-
304
-
305
-
306
-
307
-
308
-
309
-
310
-
311
-
312
-
313
-
314
-
315
-
316
-
317
-
318
-
319
-
320
-
321
-
322
-
323
-
324
-
325
-
326
-
327
-
328
-
329
-
330
-
331
-
332
-
333
-
334
-
335
-
336
-
337
-
338
-
339
-
340
-
341
-
342
-
343
-
344
-
345
-
346
-
347
-
348
-
349
-
350
-
351
-
352
-
353
-
354
-
355
-
356
-
357
-
358
-
359
-
360
-
361
-
362
-
363
-
364
-
365
-
366
-
367
-
368
-
369
-
370
-
371
-
372
-
373
-
374
-
375
-
376
-
377
-
378
-
379
-
380
-
381
-
382
-
383
-
384
-
385
-
386
-
387
-
388
-
389
-
390
-
391
-
392
-
393
-
394
-
395
-
396
-
397
-
398
-
399
-
400
-
401
-
402
 |
 |

Report on
Operations
86
Financial
Review –
Fiat Group
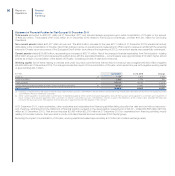
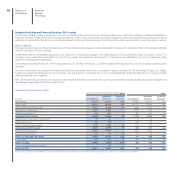
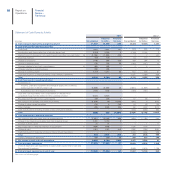
Net Debt by Activity for Fiat excluding Chrysler at 31 December 2011 and 31 December 2010
31.12.2011 31.12.2010 (*)
(€ million)
Fiat
excluding
Chrysler
Industrial
Activities
excluding
Chrysler
Financial
Services Consolidated
Industrial
Activities
Financial
Services
Debt: (16,245) (14,269) (3,595) (20,804) (19,843) (2,763)
Asset-backed financing (679) (182) (497) (533) (280) (258)
Debt payable to Discontinued Operations - - - (2,865) (2,862) (3)
Other debt (15,566) (14,087) (3,098) (17,406) (16,701) (2,502)
Financial receivables from Discontinued Operations - - - 5,626 5,621 5
Current financial receivables from
jointly-controlled financial services companies (a) 21 21 - 12 12 -
Intersegment financial receivables - 1,539 80 - 1,554 248
Debt, net of intersegment balances and current financial
receivables from jointly-controlled financial services companies (16,224) (12,709) (3,515) (15,166) (12,656) (2,510)
Other financial assets (b) 430 432 - 516 516 1
Other financial liabilities (b) (329) (328) (3) (255) (254) (2)
Other current securities 199 147 52 185 147 38
Cash and cash equivalents 10,106 10,009 97 11,967 11,705 262
Net (debt)/cash (5,818) (2,449) (3,369) (2,753) (542) (2,211)
(*) Includes impacts of the Demerger which took effect 1 January 2011
(a) Includes current debt payable by FGA Capital to other companies in the Fiat Group
(b) Includes fair value of derivative financial instruments
Given the role of the central treasury, debt for Industrial Activities (Fiat excluding Chrysler) also includes funding raised by the central treasury on behalf of
consolidated Financial Services companies (included under intersegment financial receivables).
Intersegment financial receivables for Financial Services companies, on the other hand, represent loans or advances to industrial companies – for receivables
sold to Financial Services companies that do not meet the derecognition requirements of IAS 39 – as well as cash deposited temporarily with the central
treasury.
Net debt for the Financial Services companies at 31 December 2011 was up €1,158 million over year-end 2010, due to the increased funding requirement
associated with growth of the managed portfolio (+€1,268 million) and dividends paid to industrial companies (€44 million), both of which were only partially
offset by cash generated by operating activities during the period (€55 million) and positive currency translation differences (€106 million).