Chrysler 2011 Annual Report Download - page 157
Download and view the complete annual report
Please find page 157 of the 2011 Chrysler annual report below. You can navigate through the pages in the report by either clicking on the pages listed below, or by using the keyword search tool below to find specific information within the annual report.-
 1
1 -
2
-
3
-
4
-
5
-
6
-
7
-
8
-
9
-
10
-
11
-
12
-
13
-
14
-
15
-
16
-
17
-
18
-
19
-
20
-
21
-
22
-
23
-
24
-
25
-
26
-
27
-
28
-
29
-
30
-
31
-
32
-
33
-
34
-
35
-
36
-
37
-
38
-
39
-
40
-
41
-
42
-
43
-
44
-
45
-
46
-
47
-
48
-
49
-
50
-
51
-
52
-
53
-
54
-
55
-
56
-
57
-
58
-
59
-
60
-
61
-
62
-
63
-
64
-
65
-
66
-
67
-
68
-
69
-
70
-
71
-
72
-
73
-
74
-
75
-
76
-
77
-
78
-
79
-
80
-
81
-
82
-
83
-
84
-
85
-
86
-
87
-
88
-
89
-
90
-
91
-
92
-
93
-
94
-
95
-
96
-
97
-
98
-
99
-
100
-
101
-
102
-
103
-
104
-
105
-
106
-
107
-
108
-
109
-
110
-
111
-
112
-
113
-
114
-
115
-
116
-
117
-
118
-
119
-
120
-
121
-
122
-
123
-
124
-
125
-
126
-
127
-
128
-
129
-
130
-
131
-
132
-
133
-
134
-
135
-
136
-
137
-
138
-
139
-
140
-
141
-
142
-
143
-
144
-
145
-
146
-
 147
147 -
 148
148 -
 149
149 -
 150
150 -
 151
151 -
 152
152 -
 153
153 -
 154
154 -
 155
155 -
 156
156 -
 157
157 -
 158
158 -
 159
159 -
 160
160 -
 161
161 -
 162
162 -
 163
163 -
 164
164 -
 165
165 -
 166
166 -
 167
167 -
168
-
169
-
170
-
171
-
172
-
173
-
174
-
175
-
176
-
177
-
178
-
179
-
180
-
181
-
182
-
183
-
184
-
185
-
186
-
187
-
188
-
189
-
190
-
191
-
192
-
193
-
194
-
195
-
196
-
197
-
198
-
199
-
200
-
201
-
202
-
203
-
204
-
205
-
206
-
207
-
208
-
209
-
210
-
211
-
212
-
213
-
214
-
215
-
216
-
217
-
218
-
219
-
220
-
221
-
222
-
223
-
224
-
225
-
226
-
227
-
228
-
229
-
230
-
231
-
232
-
233
-
234
-
235
-
236
-
237
-
238
-
239
-
240
-
241
-
242
-
243
-
244
-
245
-
246
-
247
-
248
-
249
-
250
-
251
-
252
-
253
-
254
-
255
-
256
-
257
-
258
-
259
-
260
-
261
-
262
-
263
-
264
-
265
-
266
-
267
-
268
-
269
-
270
-
271
-
272
-
273
-
274
-
275
-
276
-
277
-
278
-
279
-
280
-
281
-
282
-
283
-
284
-
285
-
286
-
287
-
288
-
289
-
290
-
291
-
292
-
293
-
294
-
295
-
296
-
297
-
298
-
299
-
300
-
301
-
302
-
303
-
304
-
305
-
306
-
307
-
308
-
309
-
310
-
311
-
312
-
313
-
314
-
315
-
316
-
317
-
318
-
319
-
320
-
321
-
322
-
323
-
324
-
325
-
326
-
327
-
328
-
329
-
330
-
331
-
332
-
333
-
334
-
335
-
336
-
337
-
338
-
339
-
340
-
341
-
342
-
343
-
344
-
345
-
346
-
347
-
348
-
349
-
350
-
351
-
352
-
353
-
354
-
355
-
356
-
357
-
358
-
359
-
360
-
361
-
362
-
363
-
364
-
365
-
366
-
367
-
368
-
369
-
370
-
371
-
372
-
373
-
374
-
375
-
376
-
377
-
378
-
379
-
380
-
381
-
382
-
383
-
384
-
385
-
386
-
387
-
388
-
389
-
390
-
391
-
392
-
393
-
394
-
395
-
396
-
397
-
398
-
399
-
400
-
401
-
402
 |
 |

Notes
156 Consolidated
Financial
Statements
at 31 December
2011
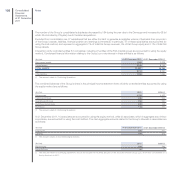
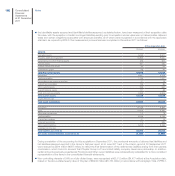
The number of the Group’s consolidated subsidiaries decreased by 184 during the year due to the Demerger and increased by 68 (of
which 66 controlled by Chrysler) due to the listed acquisitions.
Excluded from consolidation are 77 subsidiaries that are either dormant or generate a negligible volume of business: their proportion
of the Group’s assets, liabilities, financial position and earnings is immaterial. In particular, 47 of these subsidiaries are accounted for
using the cost method, and represent in aggregate 0.1% of total Fiat Group revenues, 0% of Fiat Group equity and 0.1% of total Fiat
Group assets.
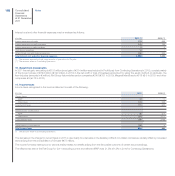
Interests in jointly controlled entities (51 companies, including 27 entities of the FGA Capital group) are accounted for using the equity
method. Condensed financial information relating to the Group’s pro-rata interest in these entities is as follows:
(€ million) At 31 December 2011 At 31 December 2010 (*)
Non-current assets 1,965 2,008
Current assets 9,242 8,744
TOTAL ASSETS 11,207 10,752
Debt 8,134 8,250
Other liabilities 1,595 1,096
(*) The amounts relate to Continuing Operations.
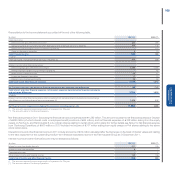
The combined balances of the Group’s share in the principal income statement items of jointly controlled entities accounted for using
the equity method are as follows:
(€ million) 2011 2010 (*)
Net revenues 4,703 4,422
Trading profit/(loss) 246 224
Operating profit/(loss) 234 220
Profit/(loss) before taxes 240 163
Profit/(loss) 143 127
(*) The amounts relate to Continuing Operations.
At 31 December 2011, 10 associates are accounted for using the equity method, while 23 associates, which in aggregate are of minor
importance, are accounted for using the cost method. The main aggregate amounts related to the Group’s interests in associates are
as follows:
(€ million) At 31 December 2011 At 31 December 2010 (*)
Total assets 386 451
Liabilities 240 312
(*) The amounts relates to the Continuing Operations.
(€ million) 2011 2010 (*)
Net revenues 208 246
Net profit/(loss) (4) (1)
(*) The amounts relate to Continuing Operations and do not include the key IFRS amounts of the associate Chrysler Group LLC, which was consolidated on a
line-by-line basis in 2011.