Chrysler 2011 Annual Report Download - page 33
Download and view the complete annual report
Please find page 33 of the 2011 Chrysler annual report below. You can navigate through the pages in the report by either clicking on the pages listed below, or by using the keyword search tool below to find specific information within the annual report.-
 1
1 -
2
-
3
-
4
-
5
-
6
-
7
-
8
-
9
-
10
-
11
-
12
-
13
-
14
-
15
-
16
-
17
-
18
-
19
-
20
-
21
-
22
-
 23
23 -
 24
24 -
 25
25 -
 26
26 -
 27
27 -
 28
28 -
 29
29 -
 30
30 -
 31
31 -
 32
32 -
 33
33 -
 34
34 -
 35
35 -
 36
36 -
 37
37 -
 38
38 -
 39
39 -
 40
40 -
 41
41 -
 42
42 -
 43
43 -
44
-
45
-
46
-
47
-
48
-
49
-
50
-
51
-
52
-
53
-
54
-
55
-
56
-
57
-
58
-
59
-
60
-
61
-
62
-
63
-
64
-
65
-
66
-
67
-
68
-
69
-
70
-
71
-
72
-
73
-
74
-
75
-
76
-
77
-
78
-
79
-
80
-
81
-
82
-
83
-
84
-
85
-
86
-
87
-
88
-
89
-
90
-
91
-
92
-
93
-
94
-
95
-
96
-
97
-
98
-
99
-
100
-
101
-
102
-
103
-
104
-
105
-
106
-
107
-
108
-
109
-
110
-
111
-
112
-
113
-
114
-
115
-
116
-
117
-
118
-
119
-
120
-
121
-
122
-
123
-
124
-
125
-
126
-
127
-
128
-
129
-
130
-
131
-
132
-
133
-
134
-
135
-
136
-
137
-
138
-
139
-
140
-
141
-
142
-
143
-
144
-
145
-
146
-
147
-
148
-
149
-
150
-
151
-
152
-
153
-
154
-
155
-
156
-
157
-
158
-
159
-
160
-
161
-
162
-
163
-
164
-
165
-
166
-
167
-
168
-
169
-
170
-
171
-
172
-
173
-
174
-
175
-
176
-
177
-
178
-
179
-
180
-
181
-
182
-
183
-
184
-
185
-
186
-
187
-
188
-
189
-
190
-
191
-
192
-
193
-
194
-
195
-
196
-
197
-
198
-
199
-
200
-
201
-
202
-
203
-
204
-
205
-
206
-
207
-
208
-
209
-
210
-
211
-
212
-
213
-
214
-
215
-
216
-
217
-
218
-
219
-
220
-
221
-
222
-
223
-
224
-
225
-
226
-
227
-
228
-
229
-
230
-
231
-
232
-
233
-
234
-
235
-
236
-
237
-
238
-
239
-
240
-
241
-
242
-
243
-
244
-
245
-
246
-
247
-
248
-
249
-
250
-
251
-
252
-
253
-
254
-
255
-
256
-
257
-
258
-
259
-
260
-
261
-
262
-
263
-
264
-
265
-
266
-
267
-
268
-
269
-
270
-
271
-
272
-
273
-
274
-
275
-
276
-
277
-
278
-
279
-
280
-
281
-
282
-
283
-
284
-
285
-
286
-
287
-
288
-
289
-
290
-
291
-
292
-
293
-
294
-
295
-
296
-
297
-
298
-
299
-
300
-
301
-
302
-
303
-
304
-
305
-
306
-
307
-
308
-
309
-
310
-
311
-
312
-
313
-
314
-
315
-
316
-
317
-
318
-
319
-
320
-
321
-
322
-
323
-
324
-
325
-
326
-
327
-
328
-
329
-
330
-
331
-
332
-
333
-
334
-
335
-
336
-
337
-
338
-
339
-
340
-
341
-
342
-
343
-
344
-
345
-
346
-
347
-
348
-
349
-
350
-
351
-
352
-
353
-
354
-
355
-
356
-
357
-
358
-
359
-
360
-
361
-
362
-
363
-
364
-
365
-
366
-
367
-
368
-
369
-
370
-
371
-
372
-
373
-
374
-
375
-
376
-
377
-
378
-
379
-
380
-
381
-
382
-
383
-
384
-
385
-
386
-
387
-
388
-
389
-
390
-
391
-
392
-
393
-
394
-
395
-
396
-
397
-
398
-
399
-
400
-
401
-
402
 |
 |
32 Report on
Operations
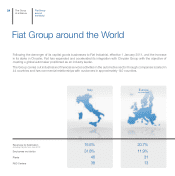
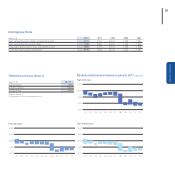
Major Shareholders
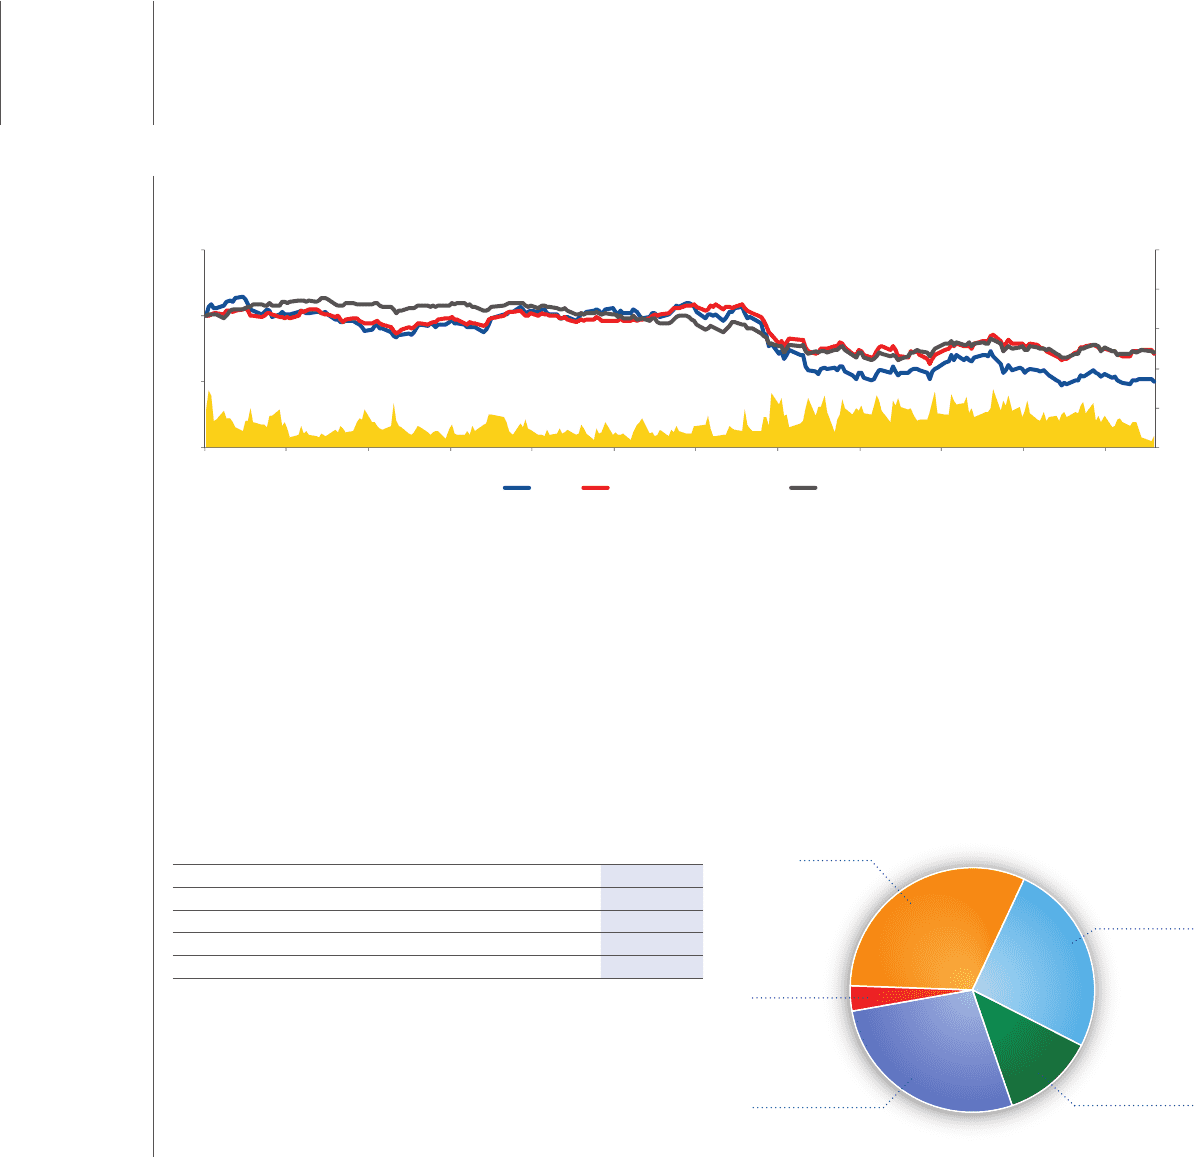
At the date of this Report, Fiat had a total of 1,092,680,610 ordinary shares outstanding and the following institutions held more than
2% of ordinary shares:
Ordinary shares: 1,092,680,610
EXOR S.p.A. (*) 30.5%
BlackRock Investment Management (UK) Limited 3.1%
Other Institutional Investors – EU 26.7%
Other Institutional Investors – outside EU 11.6%
Other shareholders 24.9%
(*) In addition to 3.2% of ordinary shares held by Fiat S.p.A.
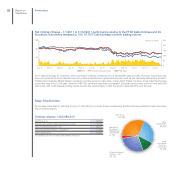
Shareholders
Fiat Ordinary Shares – 1/1/2011 to 31/12/2011 performance relative to the FTSE Italia All-Share and DJ
Eurostoxx Automotive (rebased to 100: 1/1/2011) and average monthly trading volume
2011 started strongly for investors, with most equity markets continuing 2010’s remarkable year-end rally. However, turbulence was
soon encountered as stock markets were hit by natural disasters and geopolitical shocks, such as the Japanese earthquake, floods in
Thailand and Australia, Middle Eastern uprisings, and the eurozone debt crisis. In the United States, the Dow Jones Industrial Average
ended the year with a 5.5% gain, while the S&P 500 remained essentially unchanged. European stock prices were hit hard amid the
debt crisis, with most indexes posting losses well into the double digits. In Italy, the stock market fell 25% over the year.
0
50
100
150
200
250
50
0
100
150
Jan 11 Feb 11 Mar 11 Apr 11 May 11 Jun 11 Jul 11 Aug 11 Sep 11 Oct 11 Nov 11 Dec 11
FIAT DJ Eurostoxx Automotive FTSE Italia
millions of shares
Exor S.p.A.
30.5%
Other
shareholders
24.9%
Other Institutional
Investors – EU
26.7%
BlackRock
Investment
Management
(UK) Limited
3.1%
Other
Institutional
Investors-
outside EU
11.6%