Chrysler 2011 Annual Report Download - page 206
Download and view the complete annual report
Please find page 206 of the 2011 Chrysler annual report below. You can navigate through the pages in the report by either clicking on the pages listed below, or by using the keyword search tool below to find specific information within the annual report.-
 1
1 -
2
-
3
-
4
-
5
-
6
-
7
-
8
-
9
-
10
-
11
-
12
-
13
-
14
-
15
-
16
-
17
-
18
-
19
-
20
-
21
-
22
-
23
-
24
-
25
-
26
-
27
-
28
-
29
-
30
-
31
-
32
-
33
-
34
-
35
-
36
-
37
-
38
-
39
-
40
-
41
-
42
-
43
-
44
-
45
-
46
-
47
-
48
-
49
-
50
-
51
-
52
-
53
-
54
-
55
-
56
-
57
-
58
-
59
-
60
-
61
-
62
-
63
-
64
-
65
-
66
-
67
-
68
-
69
-
70
-
71
-
72
-
73
-
74
-
75
-
76
-
77
-
78
-
79
-
80
-
81
-
82
-
83
-
84
-
85
-
86
-
87
-
88
-
89
-
90
-
91
-
92
-
93
-
94
-
95
-
96
-
97
-
98
-
99
-
100
-
101
-
102
-
103
-
104
-
105
-
106
-
107
-
108
-
109
-
110
-
111
-
112
-
113
-
114
-
115
-
116
-
117
-
118
-
119
-
120
-
121
-
122
-
123
-
124
-
125
-
126
-
127
-
128
-
129
-
130
-
131
-
132
-
133
-
134
-
135
-
136
-
137
-
138
-
139
-
140
-
141
-
142
-
143
-
144
-
145
-
146
-
147
-
148
-
149
-
150
-
151
-
152
-
153
-
154
-
155
-
156
-
157
-
158
-
159
-
160
-
161
-
162
-
163
-
164
-
165
-
166
-
167
-
168
-
169
-
170
-
171
-
172
-
173
-
174
-
175
-
176
-
177
-
178
-
179
-
180
-
181
-
182
-
183
-
184
-
185
-
186
-
187
-
188
-
189
-
190
-
191
-
192
-
193
-
194
-
195
-
 196
196 -
 197
197 -
 198
198 -
 199
199 -
 200
200 -
 201
201 -
 202
202 -
 203
203 -
 204
204 -
 205
205 -
 206
206 -
 207
207 -
 208
208 -
 209
209 -
 210
210 -
 211
211 -
 212
212 -
 213
213 -
 214
214 -
 215
215 -
 216
216 -
217
-
218
-
219
-
220
-
221
-
222
-
223
-
224
-
225
-
226
-
227
-
228
-
229
-
230
-
231
-
232
-
233
-
234
-
235
-
236
-
237
-
238
-
239
-
240
-
241
-
242
-
243
-
244
-
245
-
246
-
247
-
248
-
249
-
250
-
251
-
252
-
253
-
254
-
255
-
256
-
257
-
258
-
259
-
260
-
261
-
262
-
263
-
264
-
265
-
266
-
267
-
268
-
269
-
270
-
271
-
272
-
273
-
274
-
275
-
276
-
277
-
278
-
279
-
280
-
281
-
282
-
283
-
284
-
285
-
286
-
287
-
288
-
289
-
290
-
291
-
292
-
293
-
294
-
295
-
296
-
297
-
298
-
299
-
300
-
301
-
302
-
303
-
304
-
305
-
306
-
307
-
308
-
309
-
310
-
311
-
312
-
313
-
314
-
315
-
316
-
317
-
318
-
319
-
320
-
321
-
322
-
323
-
324
-
325
-
326
-
327
-
328
-
329
-
330
-
331
-
332
-
333
-
334
-
335
-
336
-
337
-
338
-
339
-
340
-
341
-
342
-
343
-
344
-
345
-
346
-
347
-
348
-
349
-
350
-
351
-
352
-
353
-
354
-
355
-
356
-
357
-
358
-
359
-
360
-
361
-
362
-
363
-
364
-
365
-
366
-
367
-
368
-
369
-
370
-
371
-
372
-
373
-
374
-
375
-
376
-
377
-
378
-
379
-
380
-
381
-
382
-
383
-
384
-
385
-
386
-
387
-
388
-
389
-
390
-
391
-
392
-
393
-
394
-
395
-
396
-
397
-
398
-
399
-
400
-
401
-
402
 |
 |

205
Consolidated
Financial Statements
at 31 December 2011
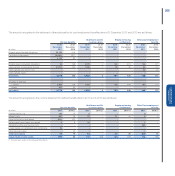
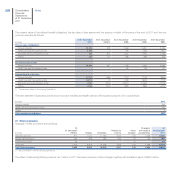
The amounts recognised in the statement of financial position for post-employment benefits plans at 31 December 2011 and 2010 are as follows:
Pension benefits
Healthcare and life
insurance plans
Employee leaving
entitlements
Other post-employment
benefits
(€ million)
At 31
December
2011
At 31
December
2010
At 31
December
2011
At 31
December
2010
At 31
December
2011
At 31
December
2010
At 31
December
2011
At 31
December
2010
Present value of funded obligations 25,106 419 ------
Fair Value of plan assets (20,004) (327) ------
5,102 92 ------
Present value of unfunded obligations 95 103 2,070 1763 811 156 127
Unrecognised actuarial gains (losses) (2,419) (75) (148) 130 35 (8) (11)
Unrecognised past service cost ------(3) (3)
Unrecognised assets --------
Net liability 2,778 120 1,922 2793 846 145 113
Amounts at year end:
Liabilities 2,863 128 1,922 2793 846 145 113
Assets (85) (8) ------
Net liability 2,778 120 1,922 2793 846 145 113
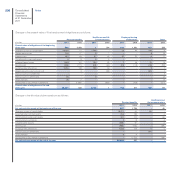
The amounts recognised in the income statement for defined benefit plans in 2011 and in 2010 are as follows:
Pension benefits
Healthcare and life
insurance plans
Employee leaving
entitlements
Other Post-employment
benefits
(€ million) 2011 2010 (*) 2011 2010 (*) 2011 2010 (*) 2011 2010 (*)
Current service cost 120 10 9---87
Interest costs 667 25 57 -21 26 65
Expected return on plan assets (816) (20) ------
Net actuarial losses (gains) recognised 43(4) ---11
(Negative) positive past service costs ------(68) -
Losses (gains) on curtailments and settlements 36 -------
Other (income) losses - (2) 1 - - - (1) -
Total Costs (gains) 11 16 63 -21 26 (54) 13
Actual return on plan assets 286 22 n/a n/a n/a n/a n/a n/a
(*) The amounts relate to Continuing Operations.