Blackberry 2014 Annual Report Download - page 89
Download and view the complete annual report
Please find page 89 of the 2014 Blackberry annual report below. You can navigate through the pages in the report by either clicking on the pages listed below, or by using the keyword search tool below to find specific information within the annual report.-
 1
1 -
2
-
3
-
4
-
5
-
6
-
7
-
8
-
9
-
10
-
11
-
12
-
13
-
14
-
15
-
16
-
17
-
18
-
19
-
20
-
21
-
22
-
23
-
24
-
25
-
26
-
27
-
28
-
29
-
30
-
31
-
32
-
33
-
34
-
35
-
36
-
37
-
38
-
39
-
40
-
41
-
42
-
43
-
44
-
45
-
46
-
47
-
48
-
49
-
50
-
51
-
52
-
53
-
54
-
55
-
56
-
57
-
58
-
59
-
60
-
61
-
62
-
63
-
64
-
65
-
66
-
67
-
68
-
69
-
70
-
71
-
72
-
73
-
74
-
75
-
76
-
77
-
78
-
 79
79 -
 80
80 -
 81
81 -
 82
82 -
 83
83 -
 84
84 -
 85
85 -
 86
86 -
 87
87 -
 88
88 -
 89
89 -
 90
90 -
 91
91 -
 92
92 -
 93
93 -
 94
94 -
 95
95 -
 96
96 -
 97
97 -
 98
98 -
 99
99 -
100
-
101
-
102
-
103
-
104
-
105
-
106
-
107
-
108
-
109
-
110
-
111
-
112
-
113
-
114
-
115
-
116
-
117
-
118
-
119
-
120
-
121
-
122
-
123
-
124
-
125
-
126
-
127
-
128
-
129
-
130
-
131
-
132
-
133
-
134
-
135
-
136
-
137
-
138
-
139
-
140
-
141
-
142
-
143
-
144
-
145
-
146
-
147
-
148
-
149
-
150
-
151
-
152
-
153
-
154
-
155
-
156
-
157
-
158
-
159
-
160
-
161
-
162
-
163
-
164
-
165
-
166
-
167
-
168
-
169
-
170
-
171
-
172
-
173
-
174
-
175
-
176
-
177
-
178
-
179
-
180
 |
 |
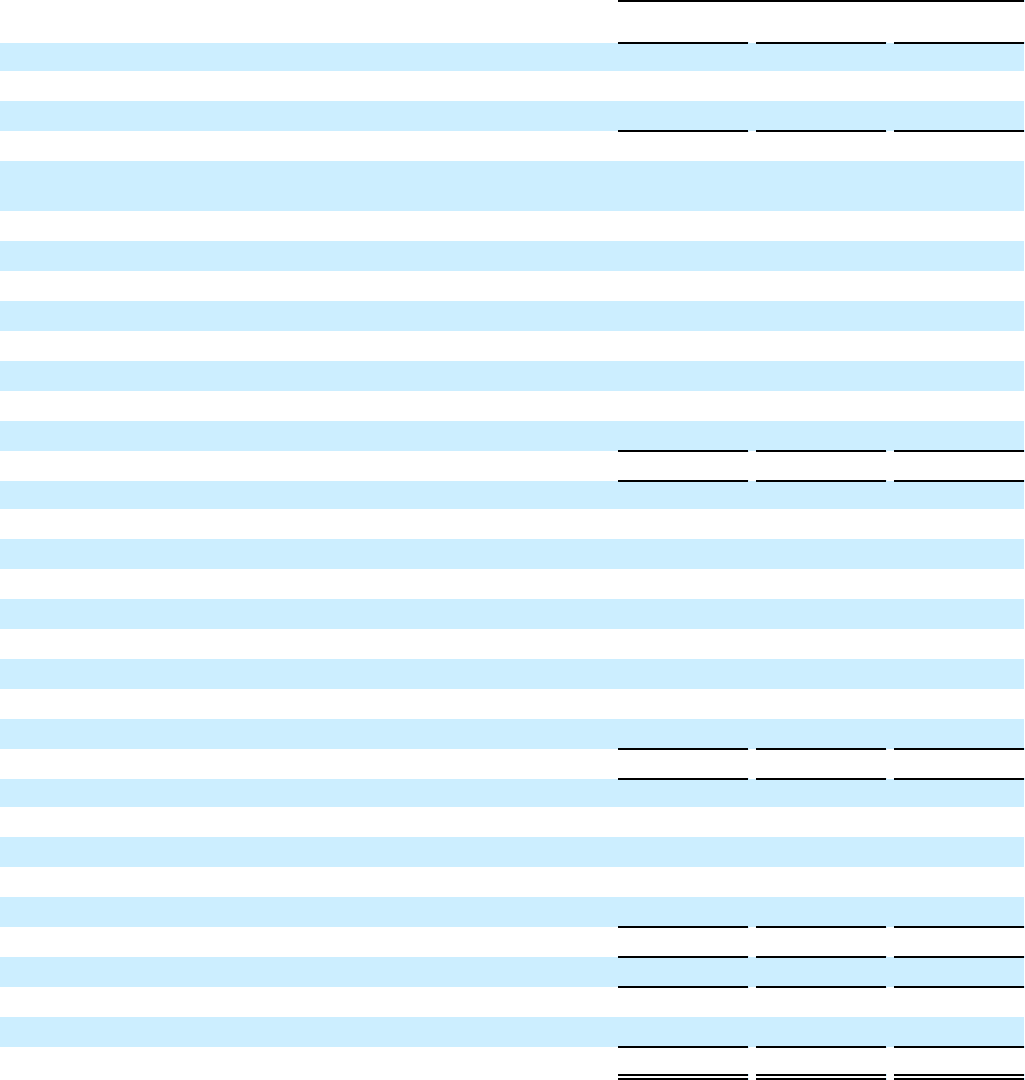
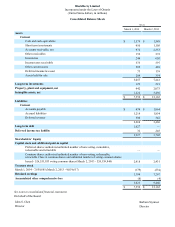
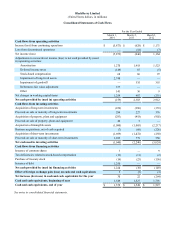
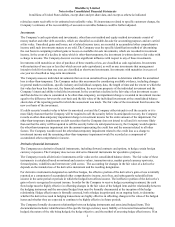
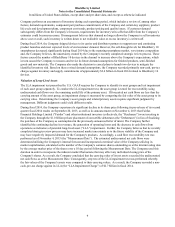
BlackBerry Limited
(United States dollars, in millions)
Consolidated Statements of Cash Flows
For the Year Ended
March 1,
2014 March 2,
2013 March 3,
2012
Cash flows from operating activities
Income (loss) from continuing operations $(5,873) $ (628) $ 1,171
Loss from discontinued operations —(18)(7)
Net income (loss) (5,873)(646) 1,164
Adjustments to reconcile net income (loss) to net cash provided by (used
in) operating activities:
Amortization 1,270 1,918 1,523
Deferred income taxes (149) 87 (5)
Stock-based compensation 68 86 97
Impairment of long-lived assets 2,748 — —
Impairment of goodwill — 335 355
Debentures fair value adjustment 377 — —
Other 141 36 9
Net changes in working capital items 1,259 487 (231)
Net cash provided by (used in) operating activities (159) 2,303 2,912
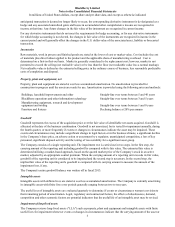
Cash flows from investing activities
Acquisition of long-term investments (229)(296)(355)
Proceeds on sale or maturity of long-term investments 284 227 376
Acquisition of property, plant and equipment (283)(418)(902)
Proceeds on sale of property, plant and equipment 49 5 —
Acquisition of intangible assets (1,080)(1,005)(2,217)
Business acquisitions, net of cash acquired (7)(60)(226)
Acquisition of short-term investments (1,699)(1,472)(250)
Proceeds on sale or maturity of short-term investments 1,925 779 550
Net cash used in investing activities (1,040)(2,240)(3,024)
Cash flows from financing activities
Issuance of common shares 3 — 9
Tax deficiencies related to stock-based compensation (13)(11)(2)
Purchase of treasury stock (16)(25)(156)
Issuance of debt 1,250 — —
Net cash provided by (used in) financing activities 1,224 (36)(149)
Effect of foreign exchange gain (loss) on cash and cash equivalents 5(5)(3)
Net increase (decrease) in cash and cash equivalents for the year 30 22 (264)
Cash and cash equivalents, beginning of year 1,549 1,527 1,791
Cash and cash equivalents, end of year $ 1,579 $ 1,549 $ 1,527
See notes to consolidated financial statements.