Blackberry 2014 Annual Report Download - page 168
Download and view the complete annual report
Please find page 168 of the 2014 Blackberry annual report below. You can navigate through the pages in the report by either clicking on the pages listed below, or by using the keyword search tool below to find specific information within the annual report.-
 1
1 -
2
-
3
-
4
-
5
-
6
-
7
-
8
-
9
-
10
-
11
-
12
-
13
-
14
-
15
-
16
-
17
-
18
-
19
-
20
-
21
-
22
-
23
-
24
-
25
-
26
-
27
-
28
-
29
-
30
-
31
-
32
-
33
-
34
-
35
-
36
-
37
-
38
-
39
-
40
-
41
-
42
-
43
-
44
-
45
-
46
-
47
-
48
-
49
-
50
-
51
-
52
-
53
-
54
-
55
-
56
-
57
-
58
-
59
-
60
-
61
-
62
-
63
-
64
-
65
-
66
-
67
-
68
-
69
-
70
-
71
-
72
-
73
-
74
-
75
-
76
-
77
-
78
-
79
-
80
-
81
-
82
-
83
-
84
-
85
-
86
-
87
-
88
-
89
-
90
-
91
-
92
-
93
-
94
-
95
-
96
-
97
-
98
-
99
-
100
-
101
-
102
-
103
-
104
-
105
-
106
-
107
-
108
-
109
-
110
-
111
-
112
-
113
-
114
-
115
-
116
-
117
-
118
-
119
-
120
-
121
-
122
-
123
-
124
-
125
-
126
-
127
-
128
-
129
-
130
-
131
-
132
-
133
-
134
-
135
-
136
-
137
-
138
-
139
-
140
-
141
-
142
-
143
-
144
-
145
-
146
-
147
-
148
-
149
-
150
-
151
-
152
-
153
-
154
-
155
-
156
-
157
-
 158
158 -
 159
159 -
 160
160 -
 161
161 -
 162
162 -
 163
163 -
 164
164 -
 165
165 -
 166
166 -
 167
167 -
 168
168 -
 169
169 -
 170
170 -
 171
171 -
 172
172 -
 173
173 -
 174
174 -
 175
175 -
 176
176 -
 177
177 -
 178
178 -
179
-
180
 |
 |

BlackBerry Limited
Management’s Discussion and Analysis of Financial Condition and Results of Operations
38
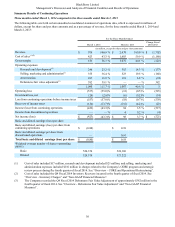
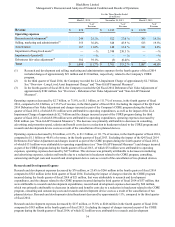
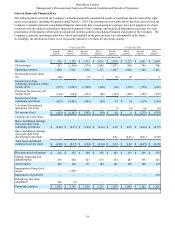
Selected Quarterly Financial Data
The following table sets forth the Company’s unaudited quarterly consolidated results of operations data for each of the eight
most recent quarters, including the quarter ended March 1, 2014. The information in the table below has been derived from the
Company’s unaudited interim consolidated financial statements that, in management’s opinion, have been prepared on a basis
consistent with the audited consolidated financial statements of the Company and include all adjustments necessary for a fair
presentation of information when read in conjunction with the audited consolidated financial statements of the Company. The
Company’s quarterly operating results have varied substantially in the past and may vary substantially in the future.
Accordingly, the information below is not necessarily indicative of results for any future quarter.
Fiscal Year 2014 Fiscal Year 2013
Fourth
Quarter Third
Quarter Second
Quarter First
Quarter Fourth
Quarter Third
Quarter Second
Quarter First
Quarter
(in millions, except per share data)
Revenue $ 976 $ 1,193 $ 1,573 $ 3,071 $ 2,678 $ 2,727 $ 2,861 $ 2,808
Gross margin 553 (1,264) (374) 1,042 1,075 830 744 786
Operating expenses 1,090 3,761 1,058 1,211 1,087 1,060 1,102 1,421
Investment income (loss),
net (20) — (6) 5 (6) 18 — 3
Income (loss) from
continuing operations, before
income taxes (557) (5,025) (1,438)(164)(18)(212)(358)(632)
Provision for (recovery of)
income taxes (134) (624) (473)(80)(112)(226)(129)(122)
Income (loss) from
continuing operations (423) (4,401) (965)(84) 94 $ 14 (229)(510)
Loss from discontinued
operations, net of tax ———— 4 (5)(6)(8)
Net income (loss) $ (423) $ (4,401) $ (965) $ (84) $ 98 $ 9 $ (235) $ (518)
Earnings (loss) per share
Basic and diluted earnings
(loss) per share from
continuing operations $ (0.80) $ (8.37) $ (1.84) $ (0.16) $ 0.18 $ 0.03 $ (0.44) $ (0.97)
Basic and diluted earnings
(loss) per share from
discontinued operations — — — — 0.01 (0.01)(0.01)(0.02)
Total basic and diluted
earnings (loss) per share $ (0.80) $ (8.37) $ (1.84) $ (0.16) $ 0.19 $ 0.02 $ (0.45) $ (0.99)
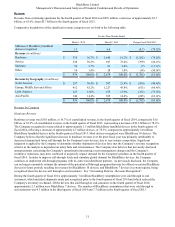
Research and development $ 246 $ 322 $ 360 $ 358 $ 383 $ 393 $ 366 $ 367
Selling, marketing and
administration 355 548 527 673 523 487 556 547
Amortization 107 148 171 180 181 180 180 172
Impairment of long-lived
assets — 2,748 — — — — — —
Impairment of goodwill ———————335
Debentures fair value
adjustment 382 (5) — — — — — —
Operating expenses $ 1,090 $ 3,761 $ 1,058 $ 1,211 $ 1,087 $ 1,060 $ 1,102 $ 1,421