Blackberry 2014 Annual Report Download - page 115
Download and view the complete annual report
Please find page 115 of the 2014 Blackberry annual report below. You can navigate through the pages in the report by either clicking on the pages listed below, or by using the keyword search tool below to find specific information within the annual report.-
 1
1 -
2
-
3
-
4
-
5
-
6
-
7
-
8
-
9
-
10
-
11
-
12
-
13
-
14
-
15
-
16
-
17
-
18
-
19
-
20
-
21
-
22
-
23
-
24
-
25
-
26
-
27
-
28
-
29
-
30
-
31
-
32
-
33
-
34
-
35
-
36
-
37
-
38
-
39
-
40
-
41
-
42
-
43
-
44
-
45
-
46
-
47
-
48
-
49
-
50
-
51
-
52
-
53
-
54
-
55
-
56
-
57
-
58
-
59
-
60
-
61
-
62
-
63
-
64
-
65
-
66
-
67
-
68
-
69
-
70
-
71
-
72
-
73
-
74
-
75
-
76
-
77
-
78
-
79
-
80
-
81
-
82
-
83
-
84
-
85
-
86
-
87
-
88
-
89
-
90
-
91
-
92
-
93
-
94
-
95
-
96
-
97
-
98
-
99
-
100
-
101
-
102
-
103
-
104
-
 105
105 -
 106
106 -
 107
107 -
 108
108 -
 109
109 -
 110
110 -
 111
111 -
 112
112 -
 113
113 -
 114
114 -
 115
115 -
 116
116 -
 117
117 -
 118
118 -
 119
119 -
 120
120 -
 121
121 -
 122
122 -
 123
123 -
 124
124 -
 125
125 -
126
-
127
-
128
-
129
-
130
-
131
-
132
-
133
-
134
-
135
-
136
-
137
-
138
-
139
-
140
-
141
-
142
-
143
-
144
-
145
-
146
-
147
-
148
-
149
-
150
-
151
-
152
-
153
-
154
-
155
-
156
-
157
-
158
-
159
-
160
-
161
-
162
-
163
-
164
-
165
-
166
-
167
-
168
-
169
-
170
-
171
-
172
-
173
-
174
-
175
-
176
-
177
-
178
-
179
-
180
 |
 |
BlackBerry Limited
Notes to the Consolidated Financial Statements
In millions of United States dollars, except share and per share data, and except as otherwise indicated
26
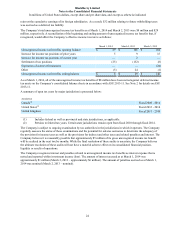
payments of approximately $19 million per year during the seven years. Fairfax, a related party, owns $500 million
principal amount of Debentures and receives interest at the same rate as other debenture holders.
In the course of issuing these Debentures, the Company incurred costs of $42 million. As the Company has elected the
fair value option for the recording of the Debentures, these costs have been fully expensed in the period in which they
were incurred and are recorded in selling, marketing and administration expenses in the statement of operations.
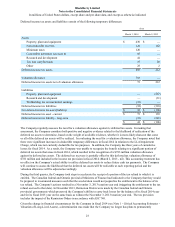
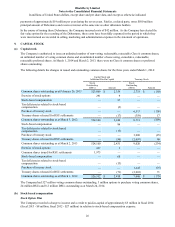
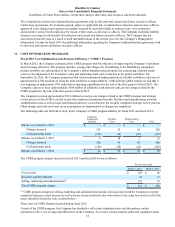
9. CAPITAL STOCK
(a) Capital stock
The Company is authorized to issue an unlimited number of non-voting, redeemable, retractable Class A common shares,
an unlimited number of voting common shares and an unlimited number of non-voting, cumulative, redeemable,
retractable preferred shares. At March 1, 2014 and March 2, 2013, there were no Class A common shares or preferred
shares outstanding.
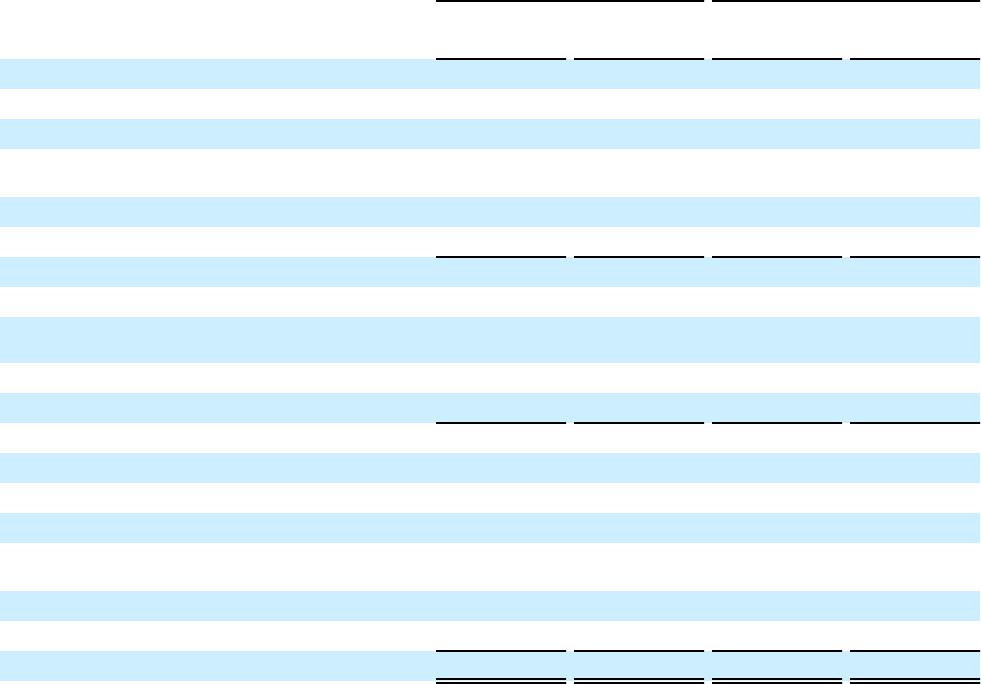
The following details the changes in issued and outstanding common shares for the three years ended March 1, 2014:
Capital Stock and
Additional Paid-In Capital Treasury Stock
Stock
Outstanding
(000’s) Amount
Stock
Outstanding
(000’s) Amount
Common shares outstanding as at February 26, 2011 523,869 $ 2,359 2,753 $ (160)
Exercise of stock options 291 9 — —
Stock-based compensation —97——
Tax deficiencies related to stock-based
compensation —(2) — —
Purchase of treasury stock — — 6,317 (156)
Treasury shares released for RSU settlements —(17)(359) 17
Common shares outstanding as at March 3, 2012 524,160 2,446 8,711 (299)
Stock-based compensation —86——
Tax deficiencies related to stock-based
compensation —(11) — —
Purchase of treasury stock — — 3,006 (25)
Treasury shares released for RSU settlements —(90)(2,697) 90
Common shares outstanding as at March 2, 2013 524,160 2,431 9,020 (234)
Exercise of stock options 417 3 — —
Common shares issued for RSU settlements 1,975 — — —
Stock-based compensation —68——
Tax deficiencies related to stock-based
compensation —(13) — —
Purchase of treasury stock — — 1,641 (16)
Treasury shares released for RSU settlements —(71)(3,001) 71
Common shares outstanding as at March 1, 2014 526,552 $ 2,418 7,660 $ (179)
The Company had 527 million voting common shares outstanding, 3 million options to purchase voting common shares,
24 million RSUs and 0.2 million DSUs outstanding as at March 24, 2014.
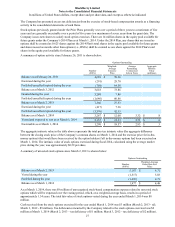
(b) Stock-based compensation
Stock Option Plan
The Company recorded a charge to income and a credit to paid-in-capital of approximately $5 million in fiscal 2014
(fiscal 2013 - $8 million; fiscal 2012 - $27 million) in relation to stock-based compensation expense.