Blackberry 2014 Annual Report Download - page 86
Download and view the complete annual report
Please find page 86 of the 2014 Blackberry annual report below. You can navigate through the pages in the report by either clicking on the pages listed below, or by using the keyword search tool below to find specific information within the annual report.-
 1
1 -
2
-
3
-
4
-
5
-
6
-
7
-
8
-
9
-
10
-
11
-
12
-
13
-
14
-
15
-
16
-
17
-
18
-
19
-
20
-
21
-
22
-
23
-
24
-
25
-
26
-
27
-
28
-
29
-
30
-
31
-
32
-
33
-
34
-
35
-
36
-
37
-
38
-
39
-
40
-
41
-
42
-
43
-
44
-
45
-
46
-
47
-
48
-
49
-
50
-
51
-
52
-
53
-
54
-
55
-
56
-
57
-
58
-
59
-
60
-
61
-
62
-
63
-
64
-
65
-
66
-
67
-
68
-
69
-
70
-
71
-
72
-
73
-
74
-
75
-
 76
76 -
 77
77 -
 78
78 -
 79
79 -
 80
80 -
 81
81 -
 82
82 -
 83
83 -
 84
84 -
 85
85 -
 86
86 -
 87
87 -
 88
88 -
 89
89 -
 90
90 -
 91
91 -
 92
92 -
 93
93 -
 94
94 -
 95
95 -
 96
96 -
97
-
98
-
99
-
100
-
101
-
102
-
103
-
104
-
105
-
106
-
107
-
108
-
109
-
110
-
111
-
112
-
113
-
114
-
115
-
116
-
117
-
118
-
119
-
120
-
121
-
122
-
123
-
124
-
125
-
126
-
127
-
128
-
129
-
130
-
131
-
132
-
133
-
134
-
135
-
136
-
137
-
138
-
139
-
140
-
141
-
142
-
143
-
144
-
145
-
146
-
147
-
148
-
149
-
150
-
151
-
152
-
153
-
154
-
155
-
156
-
157
-
158
-
159
-
160
-
161
-
162
-
163
-
164
-
165
-
166
-
167
-
168
-
169
-
170
-
171
-
172
-
173
-
174
-
175
-
176
-
177
-
178
-
179
-
180
 |
 |
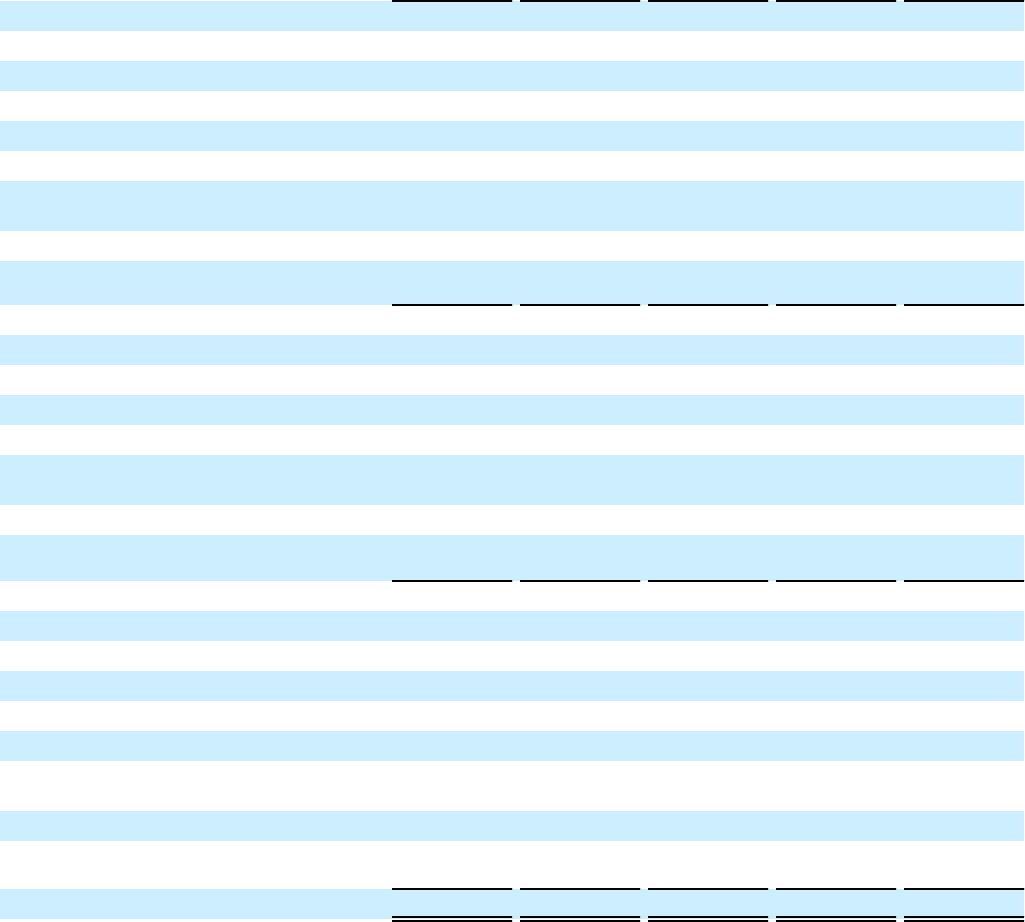
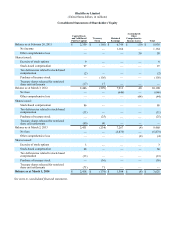
BlackBerry Limited
(United States dollars, in millions)
Consolidated Statements of Shareholders’ Equity
Capital Stock
and Additional
Paid-In Capital Treasury
Stock Retained
Earnings
Accumulated
Other
Comprehensive
Income (Loss) Total
Balance as at February 26, 2011 $ 2,359 $ (160) $ 6,749 $ (10) $ 8,938
Net income — — 1,164 — 1,164
Other comprehensive loss ———5050
Shares issued:
Exercise of stock options 9——— 9
Stock-based compensation 97———97
Tax deficiencies related to stock-based
compensation (2) — — — (2)
Purchase of treasury stock —(156) — — (156)
Treasury shares released for restricted
share unit settlements (17) 17 — — —
Balance as at March 3, 2012 2,446 (299) 7,913 40 10,100
Net loss — — (646) — (646)
Other comprehensive loss ———(44)(44)
Shares issued:
Stock-based compensation 86———86
Tax deficiencies related to stock-based
compensation (11) — — — (11)
Purchase of treasury stock —(25) — — (25)
Treasury shares released for restricted
share unit settlements (90) 90 — — —
Balance as at March 2, 2013 2,431 (234) 7,267 (4) 9,460
Net loss — — (5,873) — (5,873)
Other comprehensive loss ——— (4)(4)
Shares issued:
Exercise of stock options 3——— 3
Stock-based compensation 68———68
Tax deficiencies related to stock-based
compensation (13) — — — (13)
Purchase of treasury stock —(16) — — (16)
Treasury shares released for restricted
share unit settlements (71) 71 — — —
Balance as at March 1, 2014 $ 2,418 $ (179) $ 1,394 $ (8) $ 3,625
See notes to consolidated financial statements.